Range Partition Table Order by Index Column Limit 1 Takes a Long Time to Return

Note:
This topic has been translated from a Chinese forum by GPT and might contain errors.

Original topic: range分区表order by 索引列limit 1 长时间未返回

| username: Jellybean

Bug Report
Clearly and accurately describe the issue you found. Providing any steps to reproduce the issue can help the development team address it promptly.
[TiDB Version]
Server version: 5.7.25-TiDB-v6.1.0

[Impact of the Bug]
Order by index column does not return results for a long time

[Possible Steps to Reproduce the Issue]
Background: The table has a total of 13 billion rows, partitioned by day, with each partition having about 100 million rows.

  1. Partitioned Table
    Primary Key Index: PRIMARY KEY (dt,doc_id) /*T![clustered_index] NONCLUSTERED */,
    PRIMARY KEY (dt,doc_id) /*T![clustered_index] NONCLUSTERED */,
    KEY updatetime (updatetime),
    KEY newdate (newdate)
    ENGINE=InnoDB DEFAULT CHARSET=utf8mb4 COLLATE=utf8mb4_bin /*T![placement] PLACEMENT POLICY=storeonssd */
    PARTITION BY RANGE (UNIX_TIMESTAMP(dt))
    (PARTITION p20210601 VALUES LESS THAN (1622563200),
    …)

  2. explain
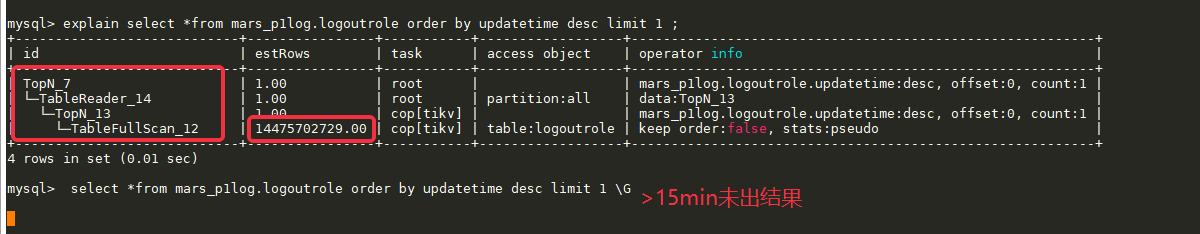
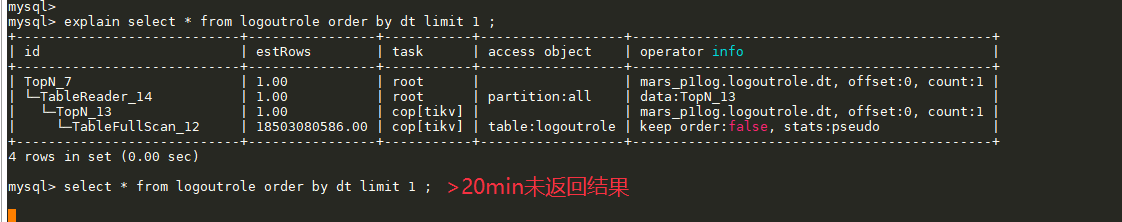
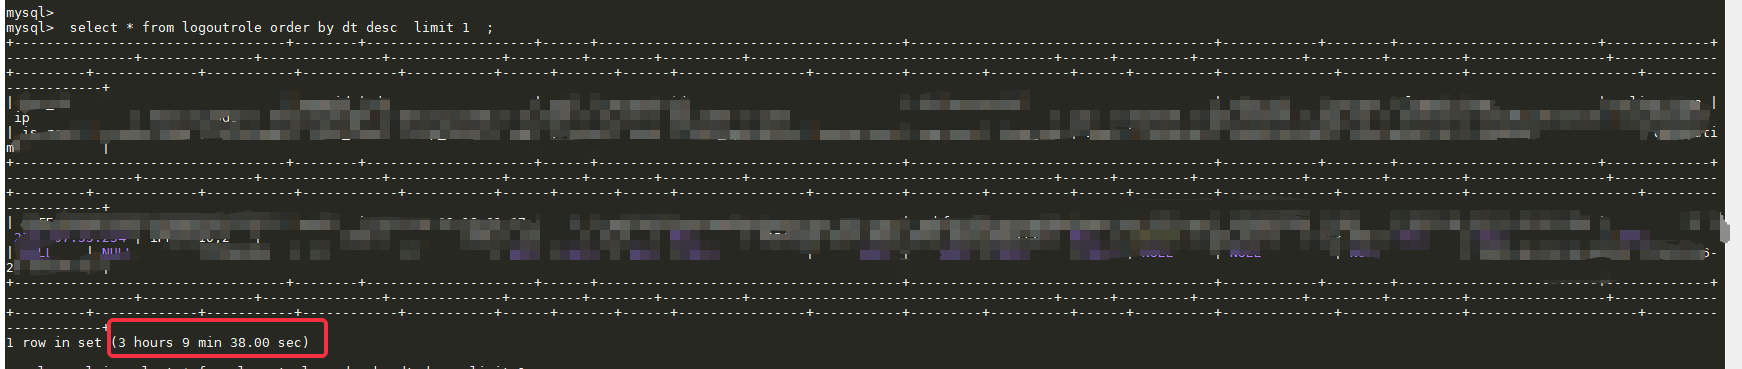
    Executed SQL: select * from logoutrole order by dt desc limit 1;

  3. Execution, no result returned for a long time

  4. View explain plan

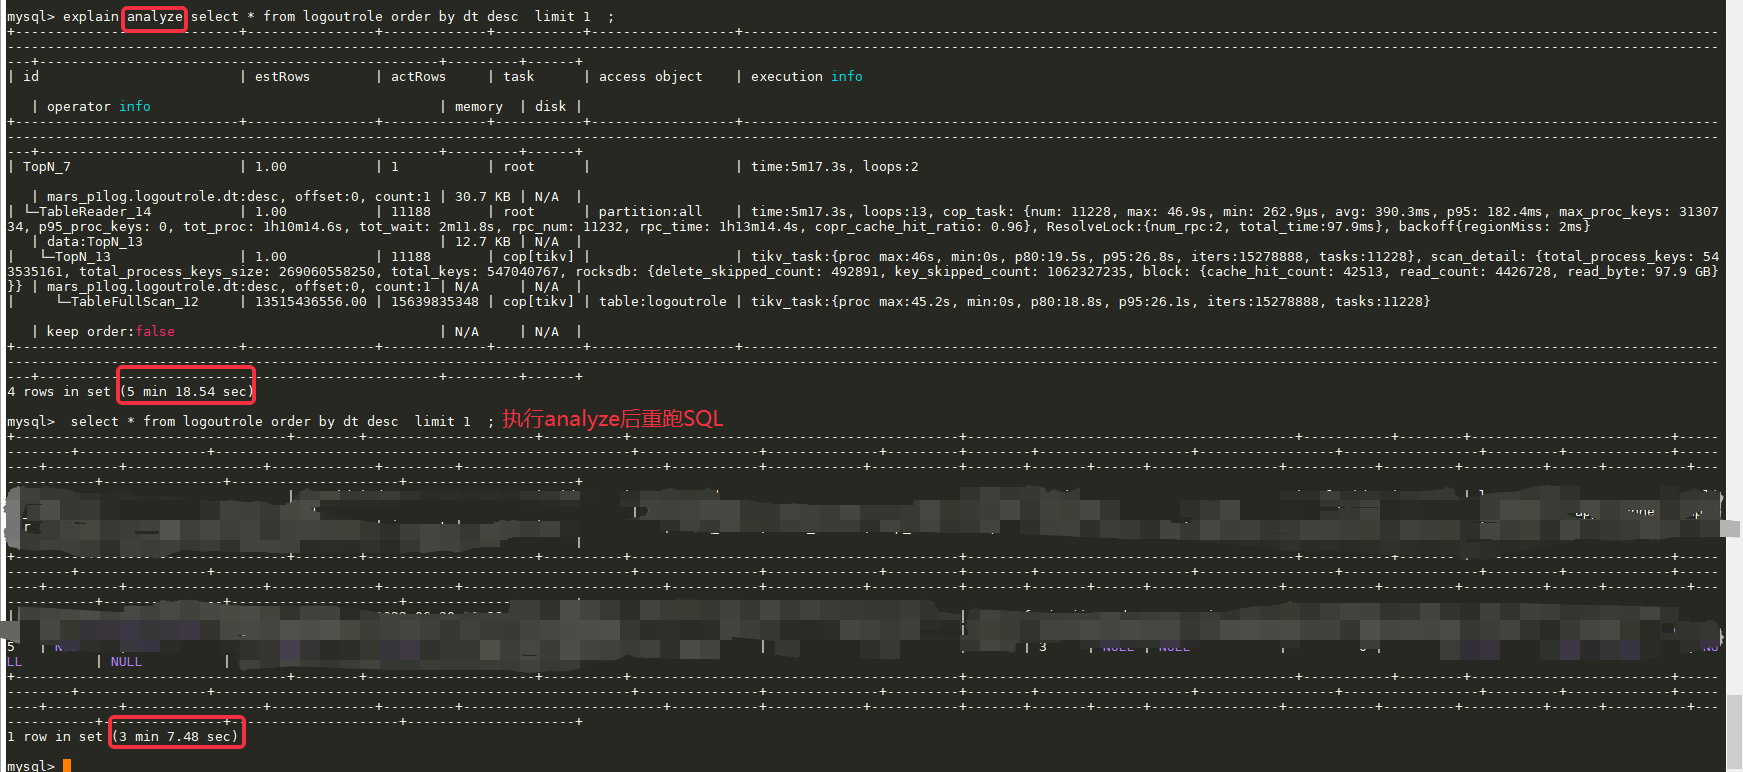
  5. Execute explain analyze and rerun, it becomes faster

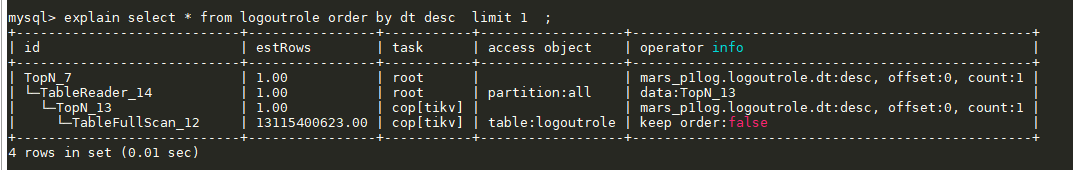
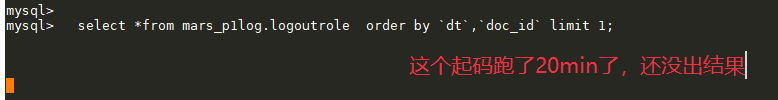
  6. Using the complete primary key index order by, still no result for a long time

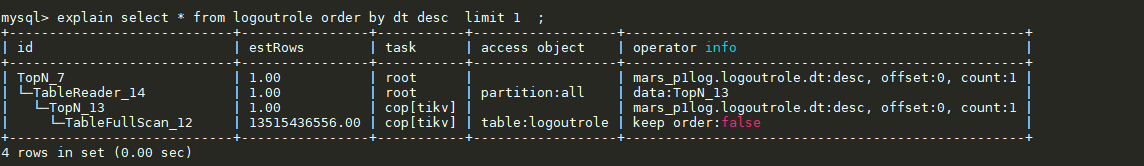
[Observed Unexpected Behavior]
No result returned for a long time, and the execution plan includes the TableFullScan_12 operator

[Expected Behavior]
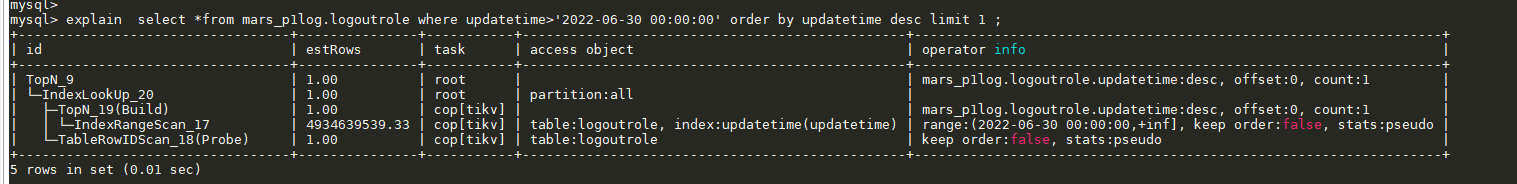
The execution plan should not require TableFullScan and should return the query results quickly

[Related Components and Specific Versions]
tidb
v6.1.0

[Other Background Information or Screenshots]
Such as cluster topology, system and kernel version, application app information, etc.; if the issue is related to SQL, please provide the SQL statement and related table schema information; if there are critical errors in the node logs, please provide the relevant node log content or files; if some business-sensitive information is inconvenient to provide, please leave contact information, and we will communicate with you privately.

| username: ddhe9527 | Original post link

Is /*+USE_INDEX(logoutrole PRIMARY)*/ effective? The MySQL client needs to add --comments.

| username: Jellybean | Original post link

The execution plan is the same. Comments have been added during login.

| username: ddhe9527 | Original post link

I see that the second force index took effect, but is it still very slow?

| username: Jellybean | Original post link

Yes, it ran for more than 15 minutes and still didn’t produce any results.

| username: xiaohetao | Original post link

Is the table very large? Try collecting some statistics.

| username: Jellybean | Original post link

The table is very large, about 14 billion rows.

Executing the analyze command also takes a long time.

| username: jiyf | Original post link

It looks more like an issue with TiDB’s execution plan for partitioned tables when using order by idx_col limit m, n.

The current execution plan calculates the top N for each partition, then aggregates the data from each partition to compute the top N. While the result should be correct, it doesn’t make good use of the inherent order of the index.

Since the current sorting column is the primary key column dt, the ideal execution plan should follow this logic:

  1. If the partition key is dt, then between partitions, the dt values are ordered, with dt values in partition p1 being less than those in partition p2.
  2. Within a partition, dt is indexed (primary key index), so within the partition, dt is ordered according to the index.

Based on the above ordering, scanning the partitioned table sequentially and using the dt index within the partition should yield the result for order by dt limit m, n, similar to the efficiency of using a non-partitioned table, just by using the limit operator.

For the current result, since the type definition of dt is unclear, there’s a possibility:
The impact of UNIX_TIMESTAMP(dt), meaning that after applying UNIX_TIMESTAMP(dt) to the dt column values, the original order of dt values might not match the order of UNIX_TIMESTAMP(dt), potentially requiring scanning all partitions.
This possibility is small, and even if it does affect, it shouldn’t require a full table scan within the partition because the dt index within the partition is still ordered. For such cases, the execution plan should be:

  1. Execute top N for all partitioned table results.
  2. Execute limit within the partitioned table.

Therefore, TiDB’s execution plan for range partitions in such cases seems to be suboptimal.

Given the current execution plan, if it takes a long time, you need to check the machine performance and related scanning parameters. After all, with a large table data volume, if the disk performance is poor and the scanning concurrency parameters are low, it is very likely to take a long time to process 13 billion records.

| username: 我是咖啡哥 | Original post link

If you have TiFlash, it should be instant. :smile:

| username: h5n1 | Original post link

Try running set session tidb_partition_prune_mode='dynamic'. Although your SQL does not involve pruning issues, there have indeed been cases where the inability to perform dynamic pruning resulted in the index not being used.

| username: Jellybean | Original post link

This cluster has always been dynamic.

mysql> show variables like 'tidb_partition_prune_mode' ;
+---------------------------+---------+
| Variable_name             | Value   |
+---------------------------+---------+
| tidb_partition_prune_mode | dynamic |
+---------------------------+---------+
1 row in set (0.01 sec)

mysql>
| username: Jellybean | Original post link

Thank you for the reply.
I agree that TiDB’s execution plan generation for range partitioned tables is not optimal. I directly replaced it with other ordinary indexes, such as KEY updatetime (updatetime), and the execution plan still requires TableFullScan_12:

| username: jiyf | Original post link

Here in the execution plan, it would be better if the TopN_13 operator is changed to a limit operator with keep order true:

  1. The limit uses the updatetime index with keep order true, scanning out the first one (satisfying limit m, n).
  2. TopN_7 performs a topN calculation on the limit results returned by each partition sub-table (each partition) and returns the data.

This issue is somewhat troublesome. If there is a strong demand for such order by limit m, n queries, there really isn’t a good query method.

Alternatively, you can try adding range queries, such as where updatetime > “xx” and updatetime < “xxx” order by updatetime limit m, n. By specifying the index column range, it will use the indexRangeScan operator, which can speed up the process.

However, this depends on whether you can reasonably add this updatetime range. If not, it seems there is no solution. We can only hope that for such queries, TiDB’s execution plan optimization will choose a better execution plan in future optimized versions.

| username: Jellybean | Original post link

Execution: select * from mars_p1log.logoutrole order by updatetime desc limit 1 \G
Time taken: 1 row in set (3 hours 16 min 56.07 sec)

As you mentioned, after adding the range query on the indexed column, it is no longer a TableFullScan but has become an IndexRangeScan_17, and the response time has shortened.

Execution: select * from mars_p1log.logoutrole where updatetime>'2022-06-30 00:00:00' order by updatetime desc limit 1;
Time taken: 1 row in set (5 min 11.59 sec)

| username: tidb狂热爱好者 | Original post link

Learned this trick to specify the range.

| username: Jellybean | Original post link

However, the execution plan still needs to scan a large amount of data, and this issue remains unresolved. It is expected to have a response in a very short time, and this issue needs to be reported to the official team.

| username: yilong | Original post link

  1. Could you please share the table structure or the attributes of the columns involved?
  2. This query checks for order by desc limit 1. If you don’t use desc and just use limit 1, is it still very time-consuming?
  3. Additionally, in the query select * from logoutrole order by dt desc limit 1;, is dt a date or time? Are you trying to get the current maximum date? If the partition table is PARTITION BY RANGE (UNIX_TIMESTAMP( dt )), based on your partitioning time pattern, is it certain that the current largest partition p20220701 has data? Does directly querying select * from p20220701 order by dt desc limit 1 meet the requirements?
| username: Jellybean | Original post link

This table has been continuously receiving data, and currently, it has around 18 billion rows.

  1. The table structure and indexes for the relevant columns are as follows:
CREATE TABLE `logoutrole` (
  `doc_id` varchar(255) NOT NULL DEFAULT '',
  `dt` timestamp NOT NULL,
  `updatetime` timestamp NOT NULL DEFAULT CURRENT_TIMESTAMP ON UPDATE CURRENT_TIMESTAMP COMMENT '更新时间',
  PRIMARY KEY (`dt`,`doc_id`) /*T![clustered_index] NONCLUSTERED */,
  KEY `updatetime` (`updatetime`)
) ENGINE=InnoDB DEFAULT CHARSET=utf8mb4 COLLATE=utf8mb4_bin /*T![placement] PLACEMENT POLICY=`storeonssd` */
PARTITION BY RANGE (UNIX_TIMESTAMP(`dt`))
(PARTITION `p20210601` VALUES LESS THAN (1622563200) /*T![placement] PLACEMENT POLICY=`storeonhdd` */,
 PARTITION `p20210602` VALUES LESS THAN (1622649600) /*T![placement] PLACEMENT POLICY=`storeonhdd` */,
...
PARTITION `p20210805` VALUES LESS THAN (1628179200) /*T![placement] PLACEMENT POLICY=`storeonhdd` */,
PARTITION `p20210806` VALUES LESS THAN (1628265600),
...
 PARTITION `p20220810` VALUES LESS THAN (1660147200),
 PARTITION `p20220811` VALUES LESS THAN (1660233600),
 PARTITION `p20220812` VALUES LESS THAN (1660320000))
1 row in set (0.00 sec)
  1. Yes, even without desc, the execution time is very long. The reason is that the execution plan includes TableFullScan_12.

  2. dt means date time, which is a timestamp.
    We cannot determine if the latest data is already in the p20220701 partition. In our case, we created all partitions from 20210601 to 20220801 at once (with a periodic task to add a new partition daily). Then, there is a data backfill task writing data into the table, starting from 20210601 and catching up to the current time. At this point, we want to see which time point it has caught up to, so we execute the statement order by updatetime or dt desc limit 1 to check.

Therefore, the issue is that executing order by updatetime or dt limit 1 is very slow.

| username: Min_Chen | Original post link

Hello, please check the TiDB-server logs for the keyword “buildCopTasks takes too much time” after executing this SQL. Thanks.

Additionally, please post the slow log of this SQL from the slow.log and the execution plan from tidb_decode. Thank you.

| username: Jellybean | Original post link

When executing, this error occurred. I’ll check the TiDB logs.