【TiDB Usage Environment】Production Environment
【TiDB Version】v7.5.0
【Reproduction Path】
【Encountered Problem: Problem Phenomenon and Impact】
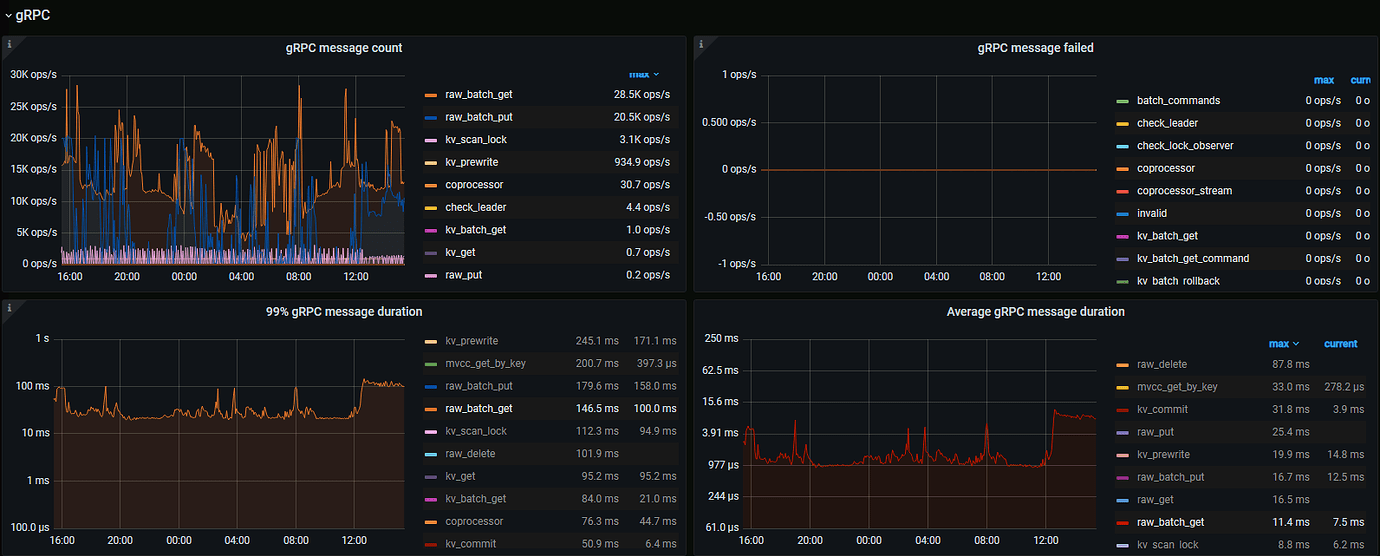
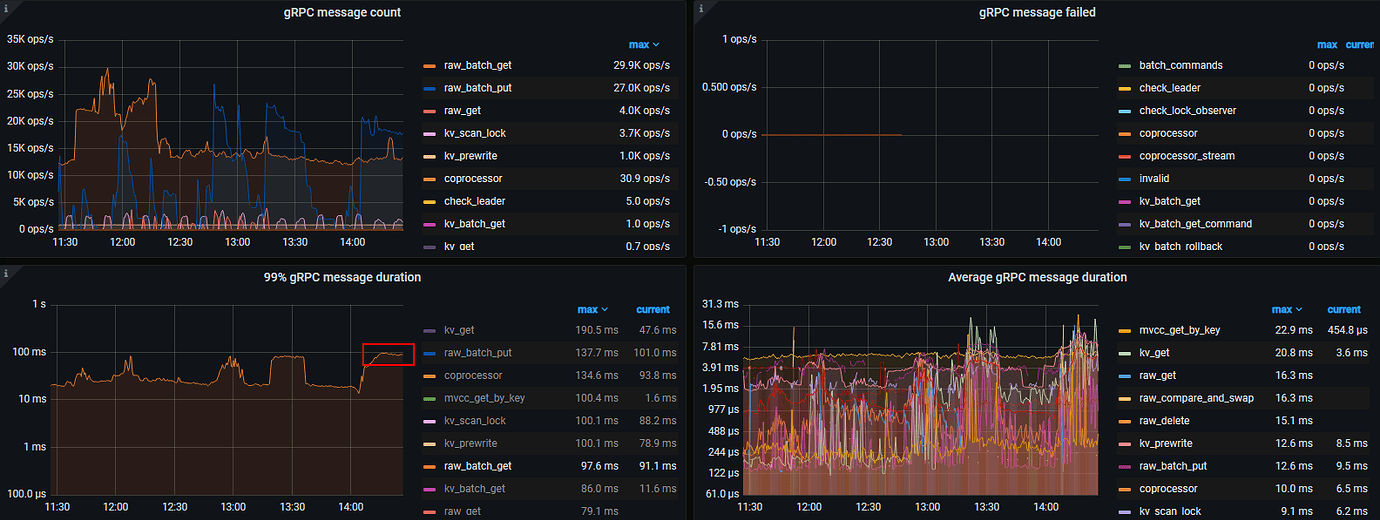
raw_batch_get 10 keys, average within 2ms, 99% greater than 100ms. No CPU or IO bottleneck, found that snapshot takes a lot of time. Suspect that LSM scanning SST files causes long-tail effect, can parameters be adjusted for optimization?
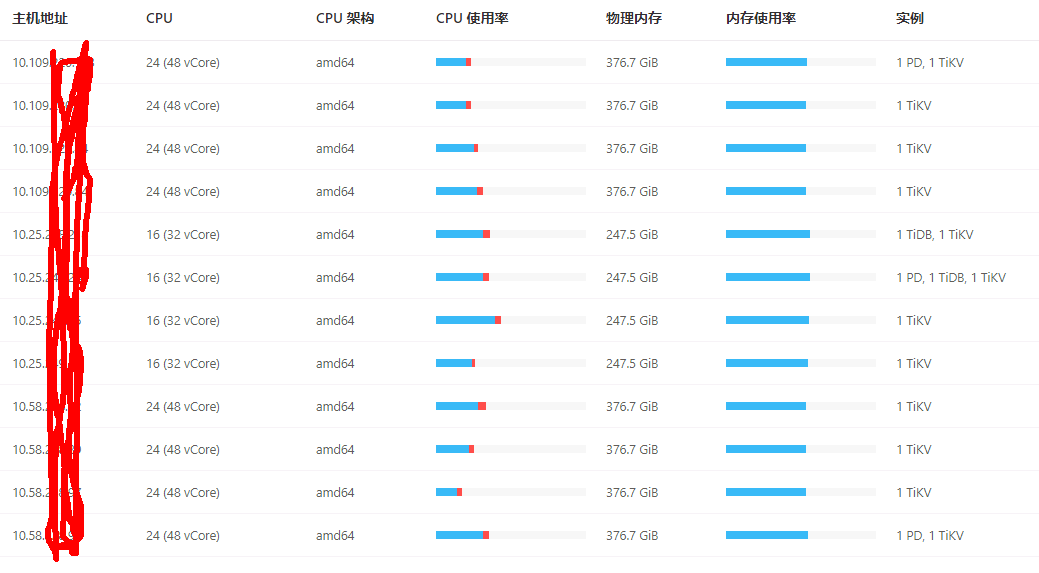
【Resource Configuration】
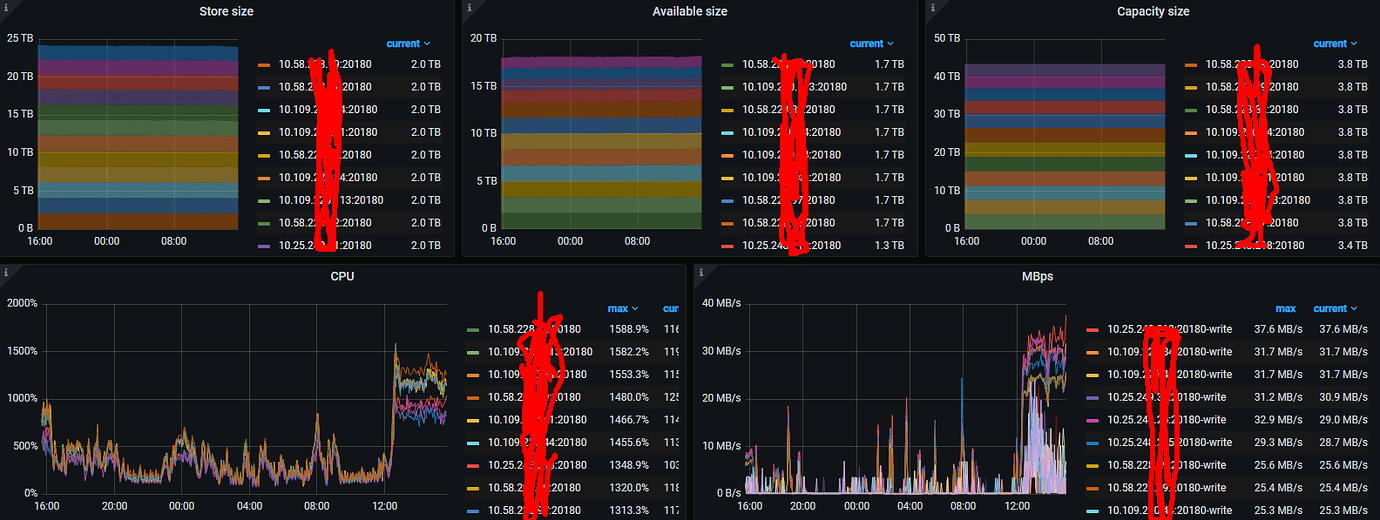
It looks like the higher the pressure, the higher the CPU usage, and the longer the response time, which seems expected. When the 99th percentile duration reaches 100ms, the traffic also reaches 30MB, and the CPU usage is around 15vc. This seems relatively expected.
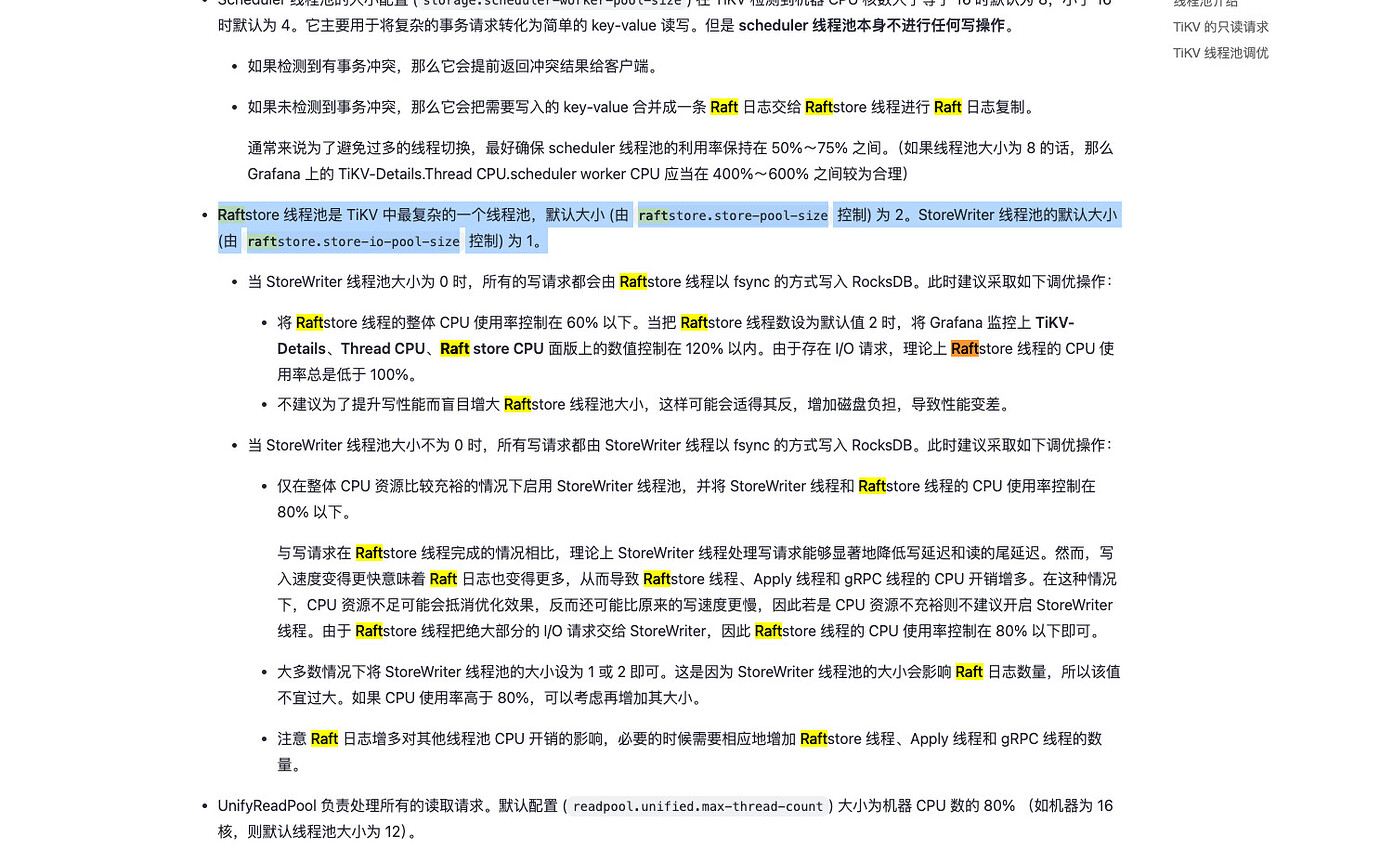
You can check this part: TiKV 线程池性能调优 | PingCAP 文档中心. See if the shared thread pool is enabled and how much CPU is allocated. Check if the grpc CPU has become a bottleneck. You can try increasing some of the default CPU configurations to see the effect.
We are using the Java client to directly interact with TiKV, utilizing raw_batch_put and raw_batch_get, without involving the TiDB role.
The thread pool settings are quite large, and the CPU usage is only around 40%, not yet reaching 80%. However, the 99% duration has increased to over 100ms.
The higher the pressure, the higher the duration, which is expected. It’s not that the CPU has no bottleneck and the duration remains unchanged under pressure.
You see, when the pressure is high, the raft store CPU seems to exceed 200%. Check if this helps:
You can adjust the topology of TiKV, enable NUMA on the server, and bind cores according to the CPU node. For example, if there are two nodes, you can deploy two instances of TiKV, each bound to one node. This should optimize the duration to some extent.
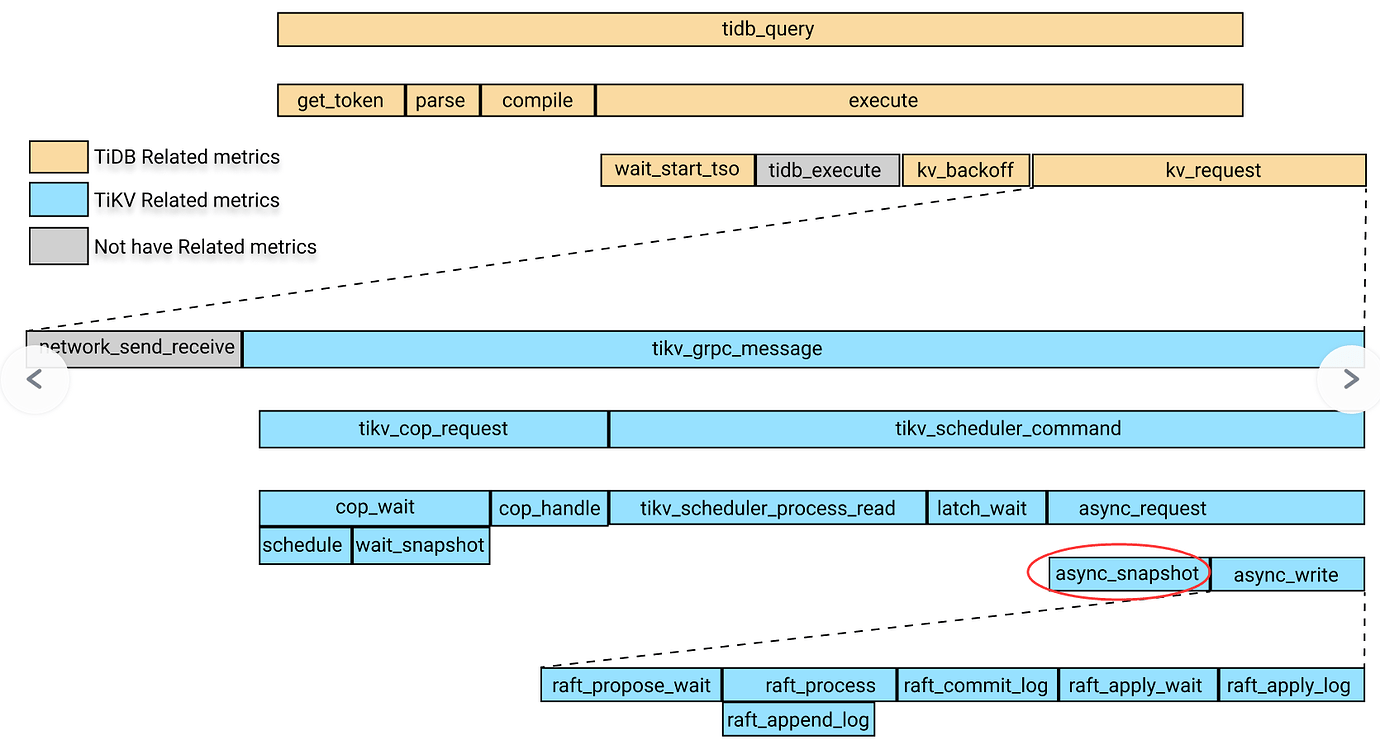
The red circle is the snapshot, which belongs to scheduler_command.
Moreover,
scheduler-worker-pool-size
The number of threads in the Scheduler thread pool. Scheduler threads are mainly responsible for transaction consistency checks before writing. If the number of CPU cores is greater than or equal to 16, the default is 8; otherwise, the default is 4. When adjusting the size of the scheduler thread pool, please refer to TiKV Thread Pool Tuning.
Default value: 4
Adjustable range: [1, MAX(4, CPU)]. Where MAX(4, CPU) means: if the number of CPU cores is less than 4, take 4; if the number of CPU cores is greater than 4, take the number of CPU cores.
Although the recommended configuration is 4, I see that you have set several thread pools quite boldly. Maybe you have more CPU resources. Can you try setting it larger than 4 and see how it works?
Previously, the storage.scheduler-worker-pool-size configuration was set very high. Later, it was found that this thread was idle, so to avoid excessive context switching, it was changed to 4.
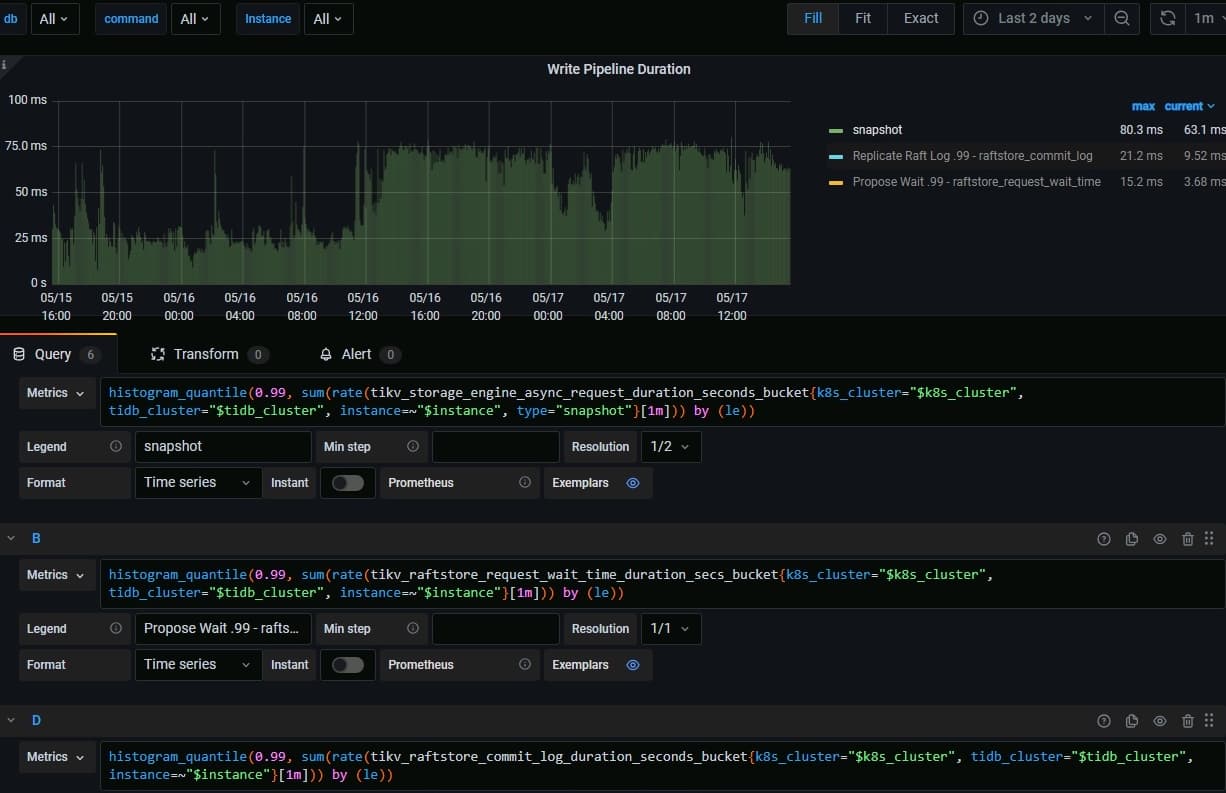
Thank you for the attention, Cat. As shown in my screenshot, the slowdown occurs at the snapshot (Replicate Raft Log + Propose Wait + xxx). Both raw_get and raw_batch_get in the source code will get a snapshot. Can this snapshot retrieval be sped up?
let snapshot =
    Self::with_tls_engine(|engine| Self::snapshot(engine, snap_ctx)).await?;
let buckets = snapshot.ext().get_buckets();
let store = RawStore::new(snapshot, api_version);
tikv_storage_engine_async_request_duration_seconds{type=“snapshot”} =
tikv_coprocessor_request_wait_seconds{type=“snapshot”} =
tikv_raftstore_request_wait_time_duration_secs +
tikv_raftstore_commit_log_duration_seconds +
get snapshot from rocksdb duration
Now it is
tikv_storage_engine_async_request_duration_second(63.1ms)
=tikv_raftstore_request_wait_time_duration_secs(3.68ms)+
tikv_raftstore_commit_log_duration_seconds(9.52ms)+ get snapshot from rocksdb duration
Although the conclusion in the documentation is
Getting a snapshot from RocksDB is usually a quick operation, so the time taken for get snapshot from rocksdb duration can be ignored.
But according to this monitoring graph, we seem to be able to draw only one conclusion. That is, get snapshot from rocksdb duration takes about 50ms.
Let’s see if any experts can think of a solution. I don’t have a good idea right now.
Based on the currently provided information, the long-tail latency of raw_batch_get is mainly caused by the increase in CPU usage due to raw_batch_put. Specifically:
According to experience, to maintain stable long-tail latency, CPU usage should be controlled below 40%. Additionally, vCores cannot actually achieve twice the performance of physical cores, usually only about 1.5 times. Since vCores on the same physical core share registers, cache, and other hardware, increasing throughput will also increase long-tail latency (refer to https://www.sciencedirect.com/science/article/pii/S0167739X22000334?via%3Dihub). Therefore, for a 24 (48 vCore) model, it is recommended to control CPU utilization below 1200% if possible, or even disable hyper-threading.
In heterogeneous mixed deployments, long-tail latency may be concentrated on the 16 (32 vCore) models, with monitoring showing that one of the CPUs has exceeded 1300% usage. It is recommended to check if the long-tail latency is concentrated on a few machines.
Increasing region size may negatively impact long-tail latency because Raft within the same region can only process serially, and increasing data volume may increase long-tail latency.
Recommendations:
Peak shaving for raw_batch_put, controlling CPU usage (calculated by physical cores) below 50%. Additionally, if possible, scatter raw_batch_put writes to avoid concentrating on a few regions at the same time.
Deploy TiKV independently and use the same model.
Adjust the model configuration, as the current model’s CPU is relatively small compared to memory. TiKV generally recommends a CPU to Memory ratio of 1:4. When using NVMe, the effect of a large block cache is not very significant. Adjusting to 32C/128GB with similar costs is believed to improve long-tail latency.