Recently, the same SQL query in TiDB has suddenly slowed down, and it was found that the Coprocessor execution time is too long

Note:
This topic has been translated from a Chinese forum by GPT and might contain errors.

Original topic: 近期tidb 同一个sql 查询突然变慢,发现 Coprocessor 执行耗时太长

| username: TiDBer_03vJ0unx

To improve efficiency, please provide the following information. Clear problem descriptions can lead to faster resolutions:
【TiDB Usage Environment】

【Overview】 Scenario + Problem Overview


【Background】 Operations performed

【Symptoms】 Business and database symptoms

【Problem】 Current issue encountered
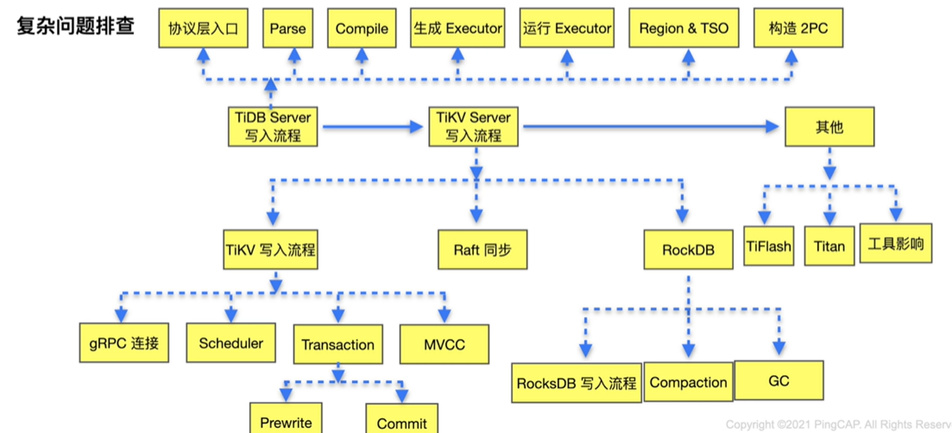
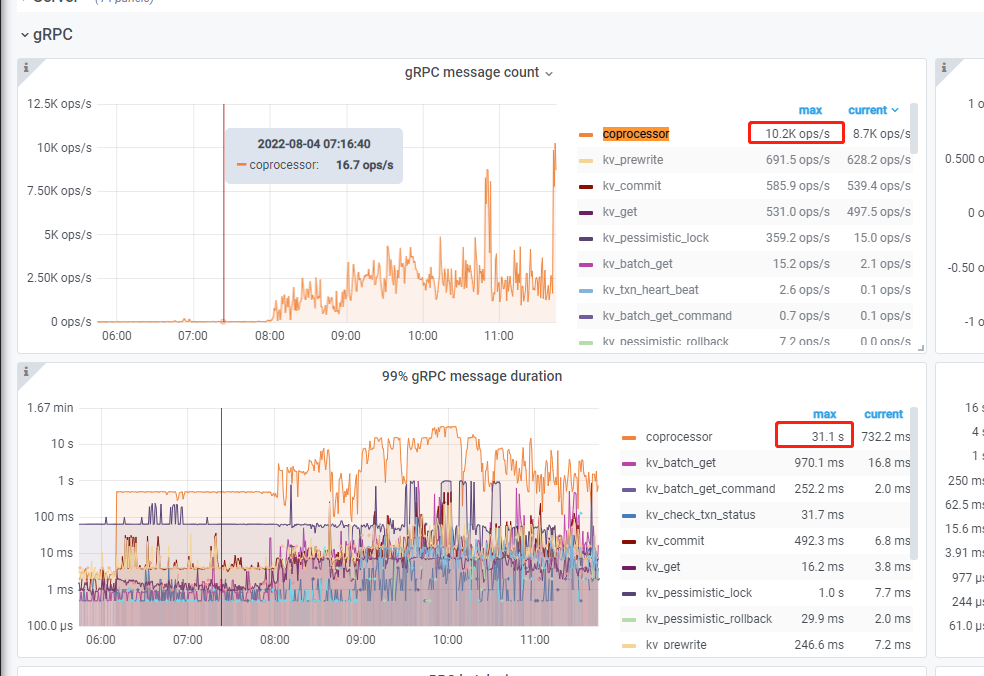
Coprocessor execution takes too long, the SQL itself is very fast. Found that grpc takes a long time, seeking help from experts
【Business Impact】

【TiDB Version】
v5.4.0
【Application Software and Version】

【Attachments】 Relevant logs and configuration information

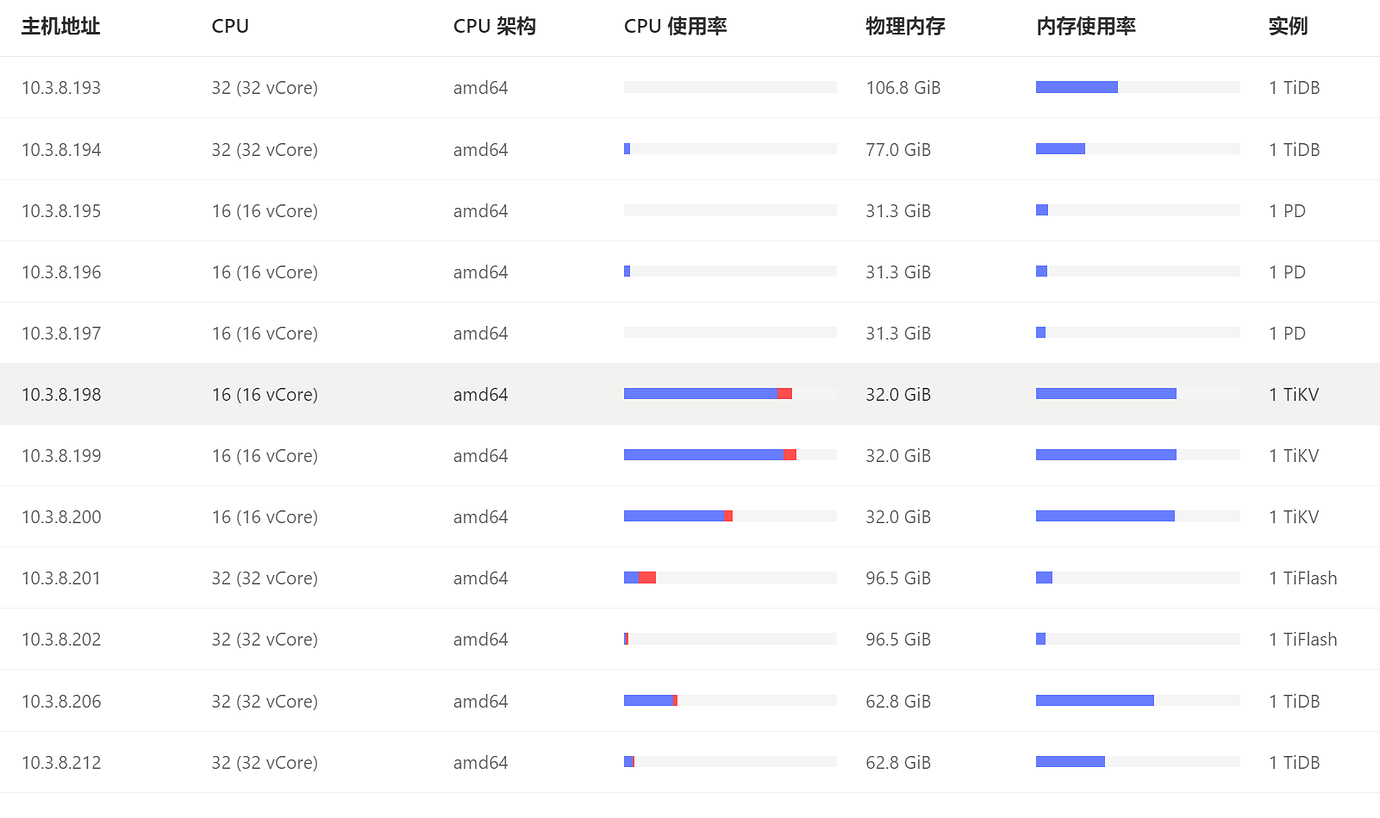
  • TiUP Cluster Display information
  • TiUP Cluster Edit config information

Monitoring (https://metricstool.pingcap.com/)

  • TiDB-Overview Grafana monitoring
  • TiDB Grafana monitoring
  • TiKV Grafana monitoring
  • PD Grafana monitoring
  • Corresponding module logs (including logs 1 hour before and after the issue)

If the question is related to performance optimization or troubleshooting, please download the script and run it. Please select all and copy-paste the terminal output results for upload.

| username: h5n1 | Original post link

  1. Check if there is any change in business volume by monitoring TiDB QPS/CPS.
  2. Check if there is any change in the amount of data processed by SQL.
  3. Check if there are any slow SQL queries with incorrect execution plans or a large number of historical versions.
  4. Determine if the bottleneck in the coprocessor is due to the network or TiKV processing.

TiDB → KV Request Duration 99 by store indicates the 99th percentile execution time of KV requests categorized by TiKV store (i.e., the time taken for TiDB to send a message to TiKV and receive feedback, categorized by message type).

TiKV-Details → 99% gRPC message duration indicates that 99% of gRPC requests have an execution time less than this value (i.e., the time taken for TiKV to process the received information and return it to TiDB, categorized by message type).

| username: cheng | Original post link

Refer to this diagram for troubleshooting

| username: cheng | Original post link

You can watch this video TiDB Advanced System Management [TiDB v5] (pingcap.com)

| username: system | Original post link

This topic will be automatically closed 60 days after the last reply. No new replies are allowed.