Reducing cross-zone communication for stale reads in Kubernetes

Hey TiDB folks,

How can I configure TiDB on Kubernetes so that stale reads within a zone don’t generate cross-zone traffic?

For example, my test K8s cluster has 3 nodes, each in a physically separate region.
In each node I’m running one PD, one KV, and one DB instance.
Here’s the K8s TidbCluster config.
Note I’m using location-labels and isolation-level to try to hint to TiDB what the network topology is.

Of course, I’ve also labeled the nodes:

> kubectl get nodes --show-labels
NAME     STATUS   ROLES    AGE    VERSION       LABELS
devenv   Ready    <none>   125m   v1.26.2+k0s   beta.kubernetes.io/arch=amd64,beta.kubernetes.io/os=linux,kubernetes.io/arch=amd64,kubernetes.io/hostname=devenv,kubernetes.io/os=linux,topology.kubernetes.io/zone=zone-devenv
td2      Ready    <none>   125m   v1.26.2+k0s   beta.kubernetes.io/arch=amd64,beta.kubernetes.io/os=linux,kubernetes.io/arch=amd64,kubernetes.io/hostname=td2,kubernetes.io/os=linux,topology.kubernetes.io/zone=zone-td2
td3      Ready    <none>   125m   v1.26.2+k0s   beta.kubernetes.io/arch=amd64,beta.kubernetes.io/os=linux,kubernetes.io/arch=amd64,kubernetes.io/hostname=td3,kubernetes.io/os=linux,topology.kubernetes.io/zone=zone-td3

Unfortunately, even when I do pure stale reads* from a zone to the DB server in the same zone, I’m seeing cross-zone traffic.
It appears as though the DB server is randomly assigning reads to KV servers, regardless of where they are.
What I expected to happen is for the DB to say “oh this is stale so my local KV can service it” and then send it to the local KV.

Thanks!

*My stale reads look like SELECT sk FROM sk AS of timestamp tidb_bounded_staleness (NOW () - INTERVAL 60 SECOND, NOW ()) WHERE pkh4 IN (...)

How much cross-node traffic will there be? How do you confirm these traffic is from your stale read request?

Thanks for the response!

I’m looking at the network traffic on each of the 3 nodes.
Before starting the reads, each node does about 50 KiBs up and down for various chatter and maintenance activities.
After starting the reads (I’m doing stale reads and nothing else), all nodes start doing about 10 MiBs up and down.
I’ve replicated this several times.

So, I’m pretty sure the cross-zone traffic is caused by stale read requests.

Relatedly, is there a dashboard / monitoring tool that shows how queries are being routed to KV servers? That might be another way to get a handle on how this is happening.

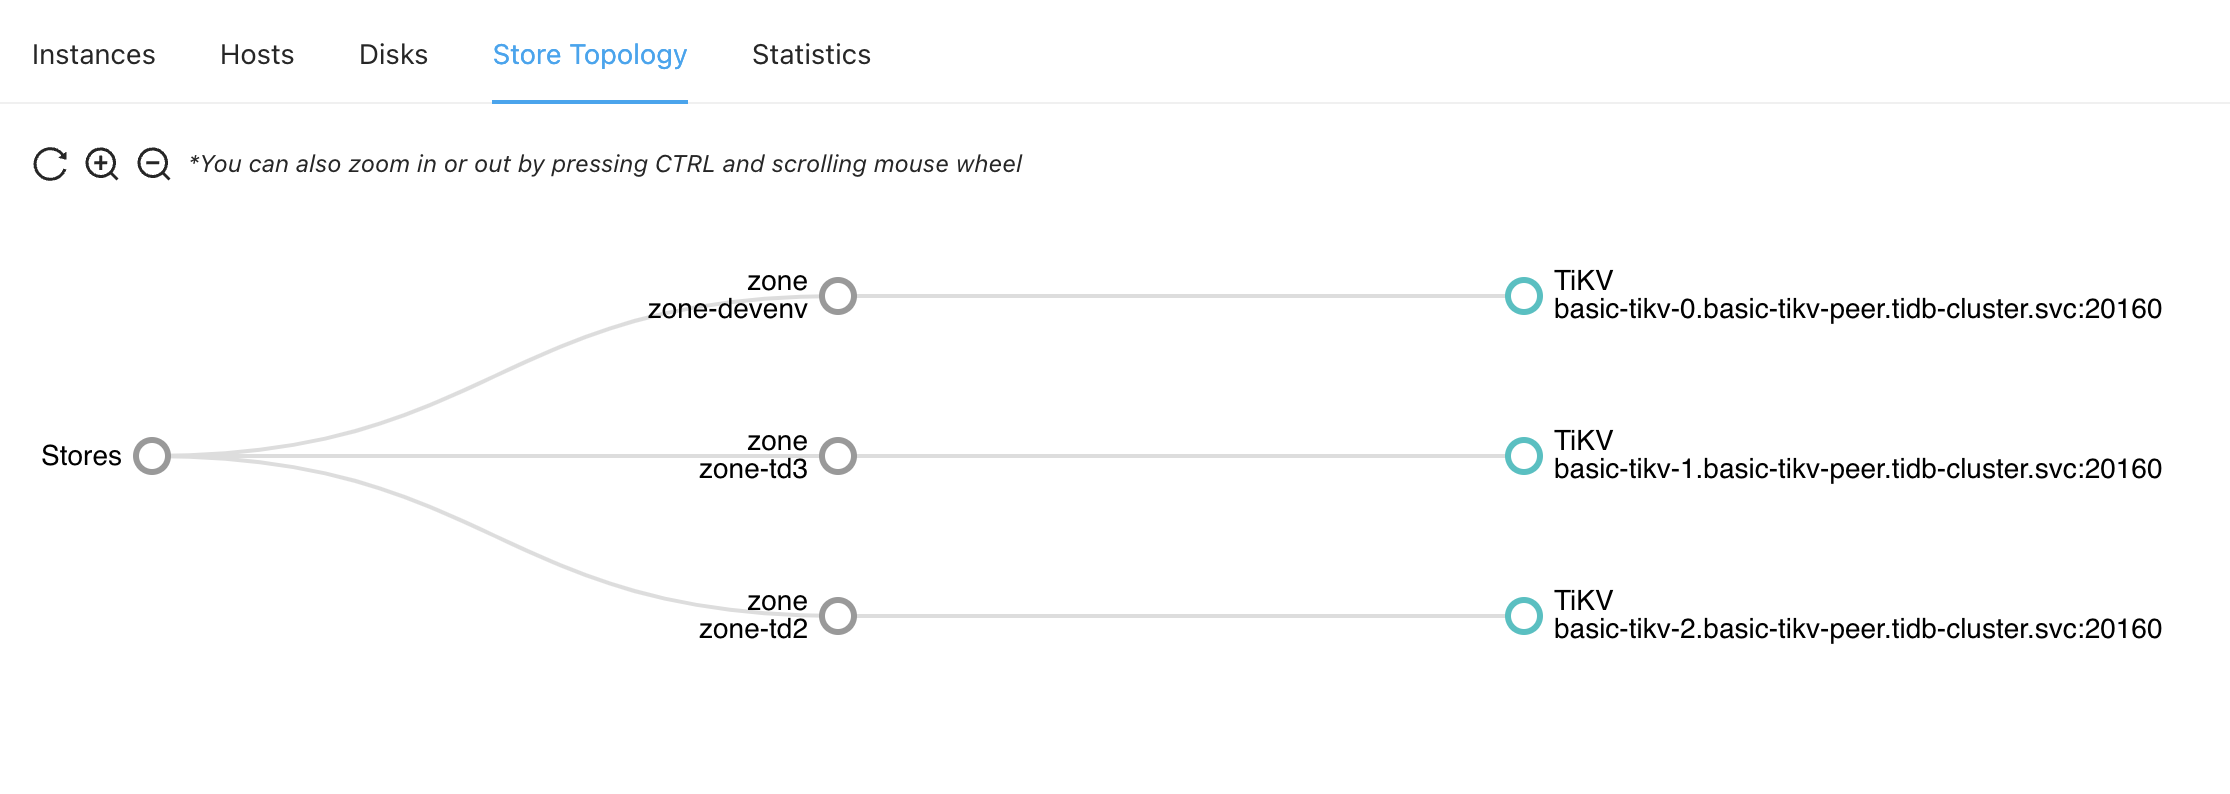
I don’t know if it helps, but here’s the store topology from TiDB Dashboard:

Have you tried tidb_replica_read = "closest-replicas"?

Thanks for the suggestions!

That did seem to help - I used set global tidb_replica_read = "closest-replicas"; to (I hope) set it globally and persistently for all future sessions.
This is what I see in a new session, so I think the setting is indeed sticky:

Screenshot 2023-03-21 at 11.45.18 AM

I also updated my config to tell the DB instances what zone they’re in (I hope) by adding config.server.labels.zone:

Together, this does seem to have reduced inter-zone traffic by maybe a factor of 5, but it is still much higher than seems right.
Here are the network stats (red boxes) for the three nodes:

As you can see, there is substantial traffic up and down (baseline is like 50 KiBs), but I have no idea why that should be.
The only zone with a process accessing the DB is the one on the left, and it’s only doing stale reads, so everything should be contained within that zone.
But for some reason all the zones have network activity.

Is there some way I can see how TiDB is choosing to route requests internally?
Maybe I could use that as a lead in debugging.

I assume hibernate-regions is already enabled.

Does the PD and/or other logging indicate region balancing operations (e.g. to balance hot reads)?

Are there any writes going on in the cluster?

What is the concern about cross region traffic? Cost? Depending on your HA requirements you could deploy the full cluster in a single AZ.

There are no TiFlash nodes in the cluster right?

Is there a clear difference between a idle cluster and a cluster with reads?

It looks like hibernate-regions isn’t set:

Do I set it with set global hibernate-regions = true?
It seems odd that it’s not set at all - maybe I’m looking in the wrong place?

There are no writes going to the cluster that I am doing - at this point I have a stripped-down test case that is only doing stale reads.
But I assume TiDB itself is doing a few writes to maintain state.

It’s mostly the cost of network traffic.
The final app will read maybe 10K rows for every write, so my strategy is to have a full copy of the DB in each region and keep the reads local.

There are no TiFlash nodes.

This is what the network looks like with no DB access:

I’m going to look through the logs now, but wanted to get back to you first with answers to your other questions.

I found something interesting in the DB log (basic-tidb-0.tdb.log):

[2023/03/21 18:49:02.451 +00:00] [WARN] [region_request.go:561] ["unable to find stores with given labels"]

Does this mean the DB is looking for a zone-local store and failing to find it?
If so, what’s the correct config to inform TiDB of the network topology?

This is my current config where I’m trying to tell it about zones (but I don’t know if this is the right way to do it).

Here are the log files:

basic-tidb-0.slowlog.log (892.5 KB)
basic-tidb-0.tidb.log (411.5 KB)

That log line is generated here:

This code might also give some more insight in how it selects the stores to read from.

I think it would be good to enhance the warning message with info about which labels it is searching for.

What labels are reported now?

$ tiup ctl:v6.6.0 pd store --jq '.stores[].store | {"store_id": .id, "labels": .labels}'
Starting component `ctl`: /home/dvaneeden/.tiup/components/ctl/v6.6.0/ctl /home/dvaneeden/.tiup/components/ctl/v6.6.0/ctl pd store --jq .stores[].store | {"store_id": .id, "labels": .labels}
{"store_id":105,"labels":[{"key":"zone","value":"z3"}]}
{"store_id":1,"labels":[{"key":"region","value":"reg1"},{"key":"zone","value":"z1"}]}
{"store_id":104,"labels":[{"key":"zone","value":"z2"}]}

For hibernate-regions, this is not a global variable, so it doesn’t show up with show variables.

sql> SHOW CONFIG WHERE Name='raftstore.hibernate-regions';
+------+-----------------+-----------------------------+-------+
| Type | Instance        | Name                        | Value |
+------+-----------------+-----------------------------+-------+
| tikv | 127.0.0.1:20160 | raftstore.hibernate-regions | true  |
| tikv | 127.0.0.1:20161 | raftstore.hibernate-regions | true  |
| tikv | 127.0.0.1:20162 | raftstore.hibernate-regions | true  |
+------+-----------------+-----------------------------+-------+
3 rows in set (0.0068 sec)

I’ve created Log request info for label warning by dveeden · Pull Request #744 · tikv/client-go · GitHub to enhance the warning message

Sorry for the delay - I was traveling.

First, I confirm that hibernate-regions is enabled:

Second, here is the output of your pd store command (I decided to get the full config).
The key is divided between two keys, which seems odd - is this the error?

Last, I’ve been using v6.5.0, but I just deleted the cluster and upgraded to v6.6.0 and I’m seeing the same thing.

Thank you again for your help!

Filtering out the ID’s and labels from your info:

$ curl -s -o - https://gist.githubusercontent.com/emchristiansen/05d82ff6179c8e073203457472cfb879/raw | sed -e '1,2d' | jq '.stores[].store | {"id": .id, "labels": .labels }'
{
  "id": 4,
  "labels": [
    {
      "key": "zone",
      "value": "topology.kubernetes.io/zone"
    },
    {
      "key": "topology.kubernetes.io/zone",
      "value": "td2"
    }
  ]
}
{
  "id": 5,
  "labels": [
    {
      "key": "zone",
      "value": "topology.kubernetes.io/zone"
    },
    {
      "key": "topology.kubernetes.io/zone",
      "value": "td3"
    }
  ]
}
{
  "id": 1,
  "labels": [
    {
      "key": "zone",
      "value": "topology.kubernetes.io/zone"
    },
    {
      "key": "topology.kubernetes.io/zone",
      "value": "devenv"
    }
  ]
}

And then looking at the zone labels:

$ curl -s -o - https://gist.githubusercontent.com/emchristiansen/05d82ff6179c8e073203457472cfb879/raw | sed -e '1,2d' | jq '.stores[].store | .labels[] | select(.key|IN("zone")) .value '
"topology.kubernetes.io/zone"

So it looks to me that all stores have the same zone label with content topology.kubernetes.io/zone and there is another label topology.kubernetes.io/zone with td2, td3 and devenv as values.

I think TiDB might only uses the zone label and not the topology.kubernetes.io/zone label and compare it with the zone label of the tidb-server process to select a store in the same zone.

Looks like this either isn’t the correct way to set the labels with k8s or that TiDB needs to be changed to use the topology.kubernetes.io/zone label instead of zone in the case of k8s.

Configure a TiDB Cluster on Kubernetes | PingCAP Docs has some more details on this

Thank you so much, that was it!
I really appreciate all your help - I don’t think I would have figured it out without you!

Here’s my final TidbCluster config.
Note the only critical lines are 22-25.

FYI, it looks like the old config, using topology.kubernetes.io/zone, partially set the zone.
You can tell because the zone is reflected in the Store Topology screenshot here.
I.e. it looks like this style is understood by some TiDB components but not all of them.

Another FYI, I tried setting location-labels: ["host"] and isolation-level: "host" and had the same problem as before - it looks like TiDB is expecting this concept to be called “zone”.

1 Like