Note:
Original topic: resource control, Grafana 面板默认配置
[TiDB Usage Environment] Production Environment / Testing / PoCGo to TiDB Dashboard - Cluster Info - Hosts and take a screenshot of this page
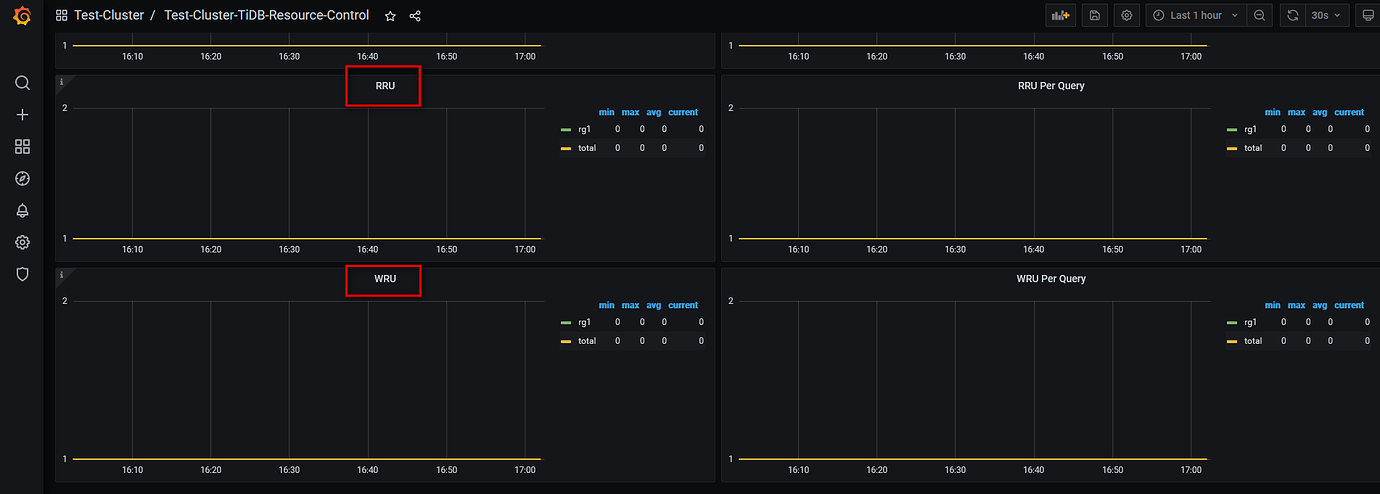
In TiDB 7.1,RRU/WRU ,
Similar to issue:
tikv:master ← nolouch:fix-consist
opened 04:22AM - 31 May 23 UTC
<!--
Thank you for working on PD! Please read PD's [CONTRIBUTING](https://git… hub.com/tikv/pd/blob/master/CONTRIBUTING.md) document **BEFORE** filing this PR.
PR Title Format:
1. pkg [, pkg2, pkg3]: what's changed
2. *: what's changed
-->
### What problem does this PR solve?
<!--
Please create an issue first to describe the problem.
There MUST be one line starting with "Issue Number: " and
linking the relevant issues via the "close" or "ref".
For more info, check https://github.com/tikv/pd/blob/master/CONTRIBUTING.md#linking-issues.
-->
Issue Number: Close https://github.com/tikv/pd/issues/6539
### What is changed and how does it work?
<!--
You could use the "commit message" code block to add more description to the final commit message.
For more info, check https://github.com/tikv/pd/blob/master/CONTRIBUTING.md#format-of-the-commit-message.
-->
```commit-message
make consistent with the ru formula
- replica number should consider for the request base
- add the batch request part
```
### Check List
Tests
- Unit test
- Integration test
- Manual test (add detailed scripts or steps below)
before:

after:

### Release note
<!--
A bugfix or a new feature needs a release note. If there is no need to give a release note, just leave it with the `None`.
Please refer to [Release Notes Language Style Guide](https://pingcap.github.io/tidb-dev-guide/contribute-to-tidb/release-notes-style-guide.html) to write a quality release note.
-->
```release-note
None.
```
Should it also be changed to RU ?
The documentation only mentions wru/rru in Grafana, which can easily cause confusion. I asked in the group but didn’t get the desired answer until I dug into this:
pingcap:master ← BornChanger:resource_control
opened 02:37PM - 12 Jan 23 UTC
Signed-off-by: BornChanger <dawn_catcher@126.com>
### First-time contribu… tors' checklist
- [X] I've signed [**Contributor License Agreement**](https://cla-assistant.io/pingcap/docs-cn) that's required for repo owners to accept my contribution.
### What is changed, added or deleted? (Required)
Add documentation for resource control feature.
### Which TiDB version(s) do your changes apply to? (Required)
**Tips for choosing the affected version(s):**
By default, **CHOOSE MASTER ONLY** so your changes will be applied to the next TiDB major or minor releases. If your PR involves a product feature behavior change or a compatibility change, **CHOOSE THE AFFECTED RELEASE BRANCH(ES) AND MASTER**.
For details, see [tips for choosing the affected versions (in Chinese)](https://github.com/pingcap/docs-cn/blob/master/CONTRIBUTING.md#版本选择指南).
- [X] master (the latest development version)
- [X] v6.6 (TiDB 6.6 versions)
- [ ] v6.5 (TiDB 6.5 versions)
- [ ] v6.4 (TiDB 6.4 versions)
- [ ] v6.1 (TiDB 6.1 versions)
- [ ] v5.4 (TiDB 5.4 versions)
- [ ] v5.3 (TiDB 5.3 versions)
- [ ] v5.2 (TiDB 5.2 versions)
- [ ] v5.1 (TiDB 5.1 versions)
- [ ] v5.0 (TiDB 5.0 versions)
### What is the related PR or file link(s)?
- This PR is translated from:
- Other reference link(s):
### Do your changes match any of the following descriptions?
- [ ] Delete files
- [ ] Change aliases
- [ ] Need modification after applied to another branch
- [ ] Might cause conflicts after applied to another branch
For users, it is RU, and there are more details in the monitoring items.
This topic was automatically closed 60 days after the last reply. New replies are no longer allowed.