Note:
This topic has been translated from a Chinese forum by GPT and might contain errors.
Original topic: 资源充足,但是tikv有一些warn报警,请教大佬如何优化性能 tidb_tikvclient_backoff_seconds_count region_miss
【TiDB Usage Environment】Production Environment
【TiDB Version】v6.5.0
【Reproduction Path】Operations performed that led to the issue
【Encountered Issue: Phenomenon and Impact】
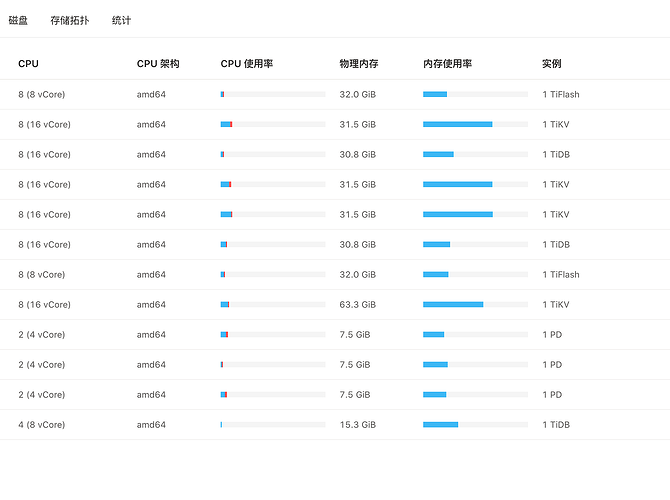
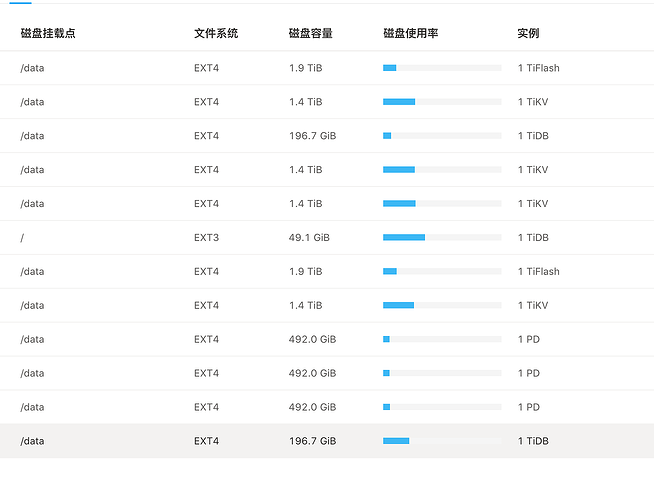
【Resource Configuration】
【Attachments: Screenshots/Logs/Monitoring】
Node warn logs:
tikv:
[2023/03/20 19:30:25.553 +08:00] [WARN] [subscription_track.rs:143] [“trying to deregister region not registered”] [region_id=1391586]
[2023/03/20 19:32:01.364 +08:00] [WARN] [endpoint.rs:780] [error-response] [err=“Region error (will back off and retry) message: "region 1298525 is missing" region_not_found { region_id: 1298525 }”]
[2023/03/20 19:32:46.285 +08:00] [WARN] [endpoint.rs:780] [error-response] [err=“Region error (will back off and retry) message: "peer is not leader for region 1300428, leader may Some(id: 1393359 store_id: 101059)" not_leader { region_id: 1300428 leader { id: 1393359 store_id: 101059 } }”]
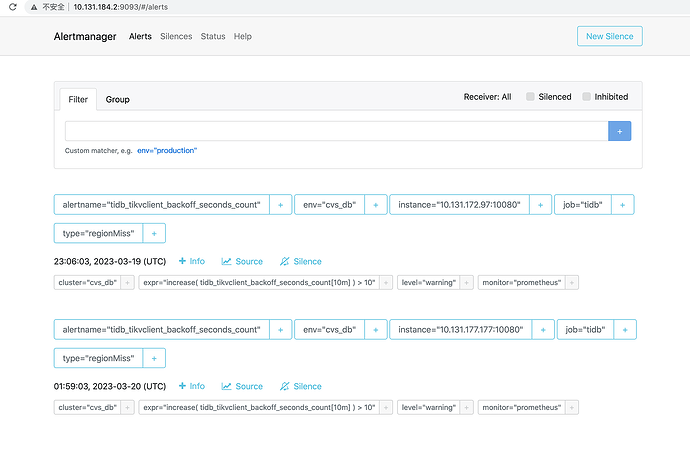
No alert information provided.
The image you provided is not accessible. Please provide the text you need translated.
tidb_tikvclient_backoff_seconds_count region miss
The hardware does not meet the minimum requirements for a production environment. Can you upgrade the configuration first?
I have plenty of resources left, far from being a bottleneck.
Looking at this, it seems to have no impact on the business.
Yes, otherwise there will be warning alarms, which is uncomfortable and makes one feel that once the business writes more data, there will be various problems.
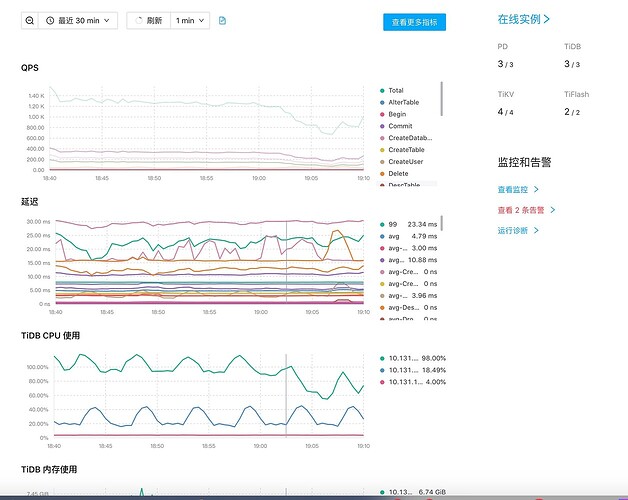
If you can understand this diagram, it means you really get it.
I told you what it is: the read and write operations have exceeded the capacity of your cluster.
Could you please explain it?
The warning is likely caused by outdated information carried by requests when a region undergoes a split or a leader switch.
Usually, these warning messages have no impact and are part of the normal internal region scheduling process, which can generally be handled by the cluster itself. If you are concerned, you can monitor the cluster’s QPS, latency, and other metrics.
If this error is due to read I/O limitations, it will recover on its own after some time. You don’t need to handle it; it will resolve itself.
In the past, I also frequently encountered this error.
- Did you have any frequent business operations when the error occurred?
Also, are there large tables, such as those with billions of rows, that are frequently subjected to DML operations? Check the statistics to see if the table has been analyzed.
It’s not a very large amount, right? A partitioned table with over 2 billion rows, and more than a hundred inserts per second.
Analyze the configuration below??? Is it caused by analyze?
select * from information_schema.analyze_status;
select * from mysql.analyze_jobs;


