Note:
This topic has been translated from a Chinese forum by GPT and might contain errors.Original topic: 同一SQL,不同tidb实例 结果不一致(执行计划也不一致)
[TiDB Usage Environment] Production Environment
[TiDB Version] 6.1.2
[Encountered Problem: Phenomenon and Impact]
The same SQL yields inconsistent results on different TiDB instances.
SQL Statement
SELECT
	a.*
FROM
	(
		SELECT
			a.*, ROUND(a.stat_cost * 100 / b.cost, 2) cost_rate,
			a.stat_cost cost,
			ROUND(a.ad_created * 100 / b.ad_created, 2) ad_created_rate,
			ROUND(a.valid_ads * 100 / b.valid_ads, 2) valid_ads_rate,
			ROUND(a.operates * 100 / b.operates, 2) operates_rate
		FROM
			(
				SELECT
					a.*,@rowNum :=@rowNum + 1 AS num
				FROM
					(
						SELECT
							operator,
							operator_name,
							ROUND(SUM(cost) / 1000000, 2) stat_cost,
							ROUND(SUM(goal_cost) / 1000000, 2) goal_cost,
							SUM(ad_created) ad_created,
							SUM(valid_ads) valid_ads,
							SUM(operates) operates,
							pdei.position,
							a.dept_id,
							a.dept_name,
							pdui.avatar,
							CASE
						WHEN pdui.position LIKE 'Manager' THEN
							operator_name
						ELSE
							''
						END manager
						FROM
							account_board_stat_daily_copy a
						LEFT JOIN pig_dd_employee_info pdei ON a.operator = pdei.user_id
						LEFT JOIN mbg_core.pig_dd_user_info pdui ON a.operator = pdui.userid
						WHERE
							stat_date BETWEEN '2023-02-27'
					AND '2023-03-04'
						AND operator > 1000
						AND operate_type IN (0, 3)
						GROUP BY
							operator
						ORDER BY
							stat_cost ASC
					) a,
					(SELECT @rowNum := 0) b
			) a
		LEFT JOIN (
			SELECT
				a.*
			FROM
				(
					SELECT
						operator,
						operator_name,
						ROUND(SUM(cost) / 1000000, 2) cost,
						ROUND(SUM(goal_cost) / 1000000, 2) goal_cost,
						SUM(ad_created) ad_created,
						SUM(valid_ads) valid_ads,
						SUM(operates) operates,
						pdei.position,
						a.dept_id,
						a.dept_name,
						pdui.avatar
					FROM
						account_board_stat_daily_copy a
					LEFT JOIN pig_dd_employee_info pdei ON a.operator = pdei.user_id
					LEFT JOIN mbg_core.pig_dd_user_info pdui ON a.operator = pdui.userid
					WHERE
						stat_date BETWEEN '2023-02-20'
					AND '2023-02-26'
					AND operator > 0
					AND operate_type IN (0, 3)
					GROUP BY
						operator
					ORDER BY
						cost
				) a
		) b ON a.operator = b.operator
	) a
WHERE
	1 = 1
ORDER BY
	a.num ASC
LIMIT 0,
 100
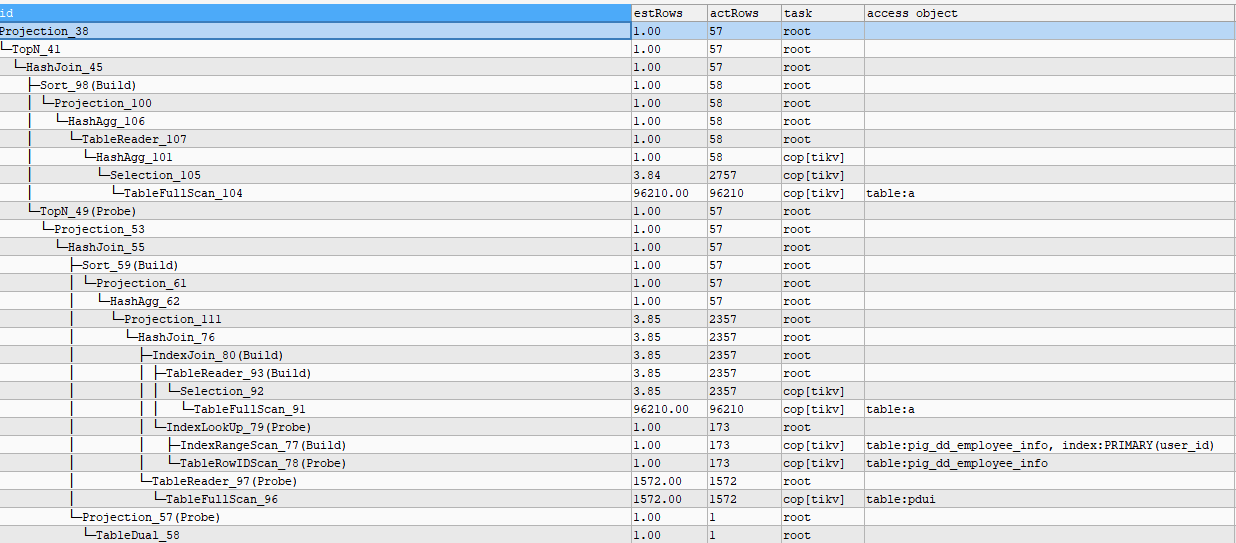
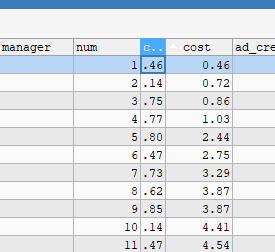
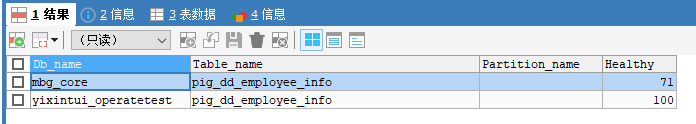
Abnormal Result:
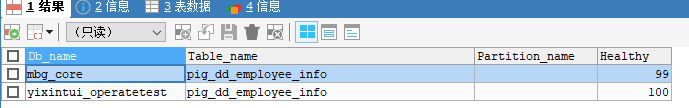
Health
Execution Plan
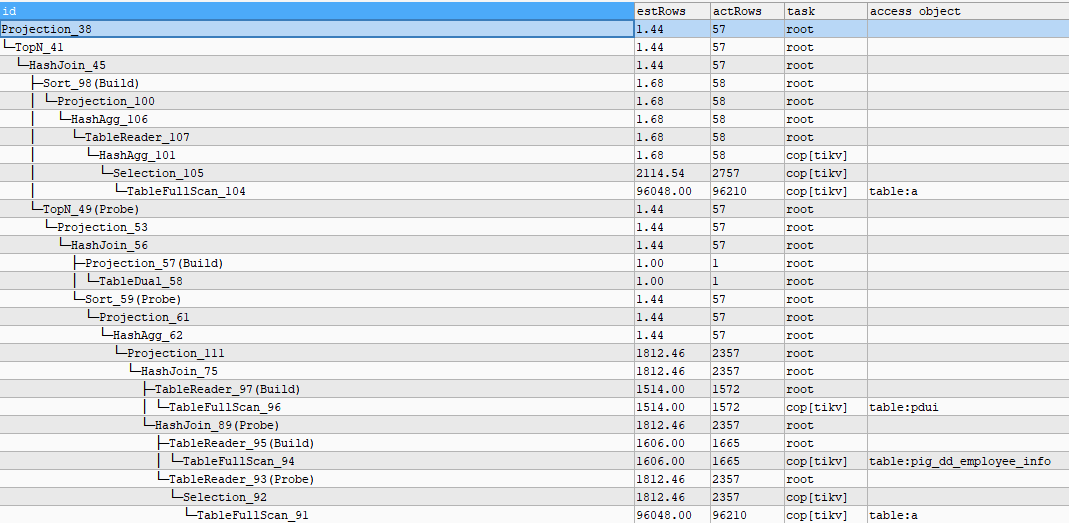
Normal Result TiDB Instance
Health
Execution Plan