Note:
This topic has been translated from a Chinese forum by GPT and might contain errors.
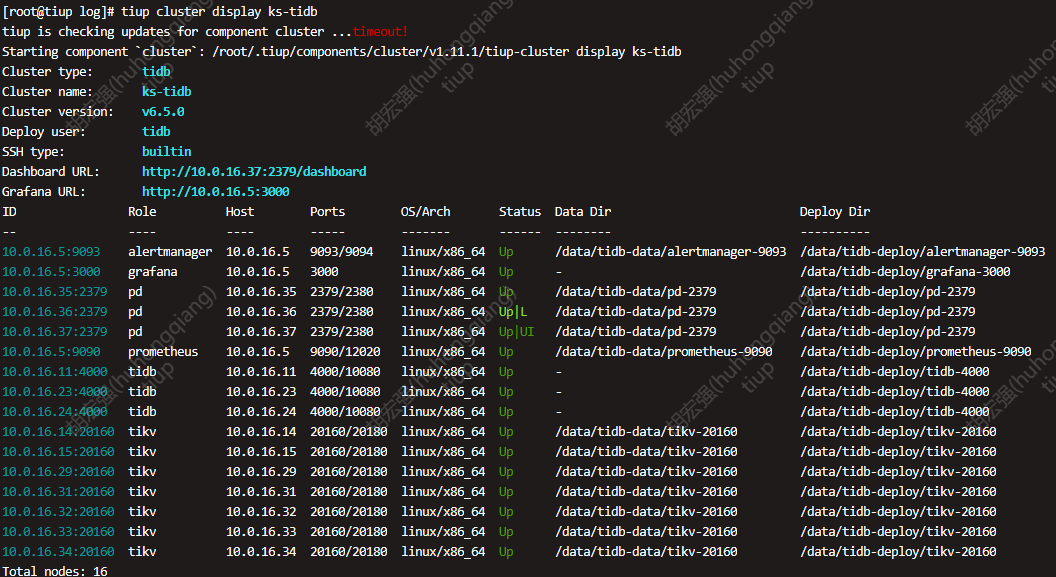
Original topic: 缩容某pd ,tiup display 已看不到,但是一直告警该pd down。
[TiDB Usage Environment] Production Environment / Testing / PoC
[TiDB Version] V6.5.0
[Reproduction Path] What operations were performed that led to the issue
[Encountered Issue: Issue Phenomenon and Impact]
[Resource Configuration] Go to TiDB Dashboard - Cluster Info - Hosts and take a screenshot of this page
[Attachments: Screenshots/Logs/Monitoring]
Can you still see this node in the member section of pdctl?
No, so it’s very strange.
After a while, it disappears. I’ve encountered something similar before.
If it’s not in PD but only in the monitoring, then just reload Prometheus…
Or simply use tiup cluster reload tidbname to reload the cluster.
Try restarting the monitoring or Grafana.
Under normal circumstances, you can reload the node or restart the cluster. However, production clusters generally do not have the conditions for a restart.
If it’s not in PD, only in the monitoring, then just reload Prometheus.

