Context and Background
Multiple applications on Flipkart rely on MySQL as their datastore. They benefit from its ability to offer transactional guarantees, handle high queries per second (QPS), and maintain low latency when appropriately configured and optimized.
As the user traffic on Flipkart grew over the years, the QPS demands of these applications also increased. The team continued to vertically scale the MySQL cluster to meet the requirements until it was running on bare metal servers. At this point, it was necessary to explore horizontally scalable solutions to be able to scale the application further.
We considered TiDB
All these limitations of MySQL databases prompted application teams to seek an alternative solution. TiDB, a distributed SQL database, was considered a potential solution because it is horizontally scalable and MySQL compatible. This meant that applications that were currently on MySQL could switch to TiDB without requiring significant changes at the application level.
Flipkart has been using TiDB as a hot store in production since early 2021 for moderate throughput levels of 60k reads and 15k writes at DB level QPS. We set out to demonstrate the feasibility of using TiDB as a hot SQL data store for use cases with very high query per second (QPS) and low latency requirements, for the first time.
This article attempts to summarize how we tested TiDB for high throughput requirements, and share the results, observations, and learnings from the exercise.
We set these goals
We selected one of the high-throughput use cases in Flipkart to demonstrate the following performance expectations from TiDB:
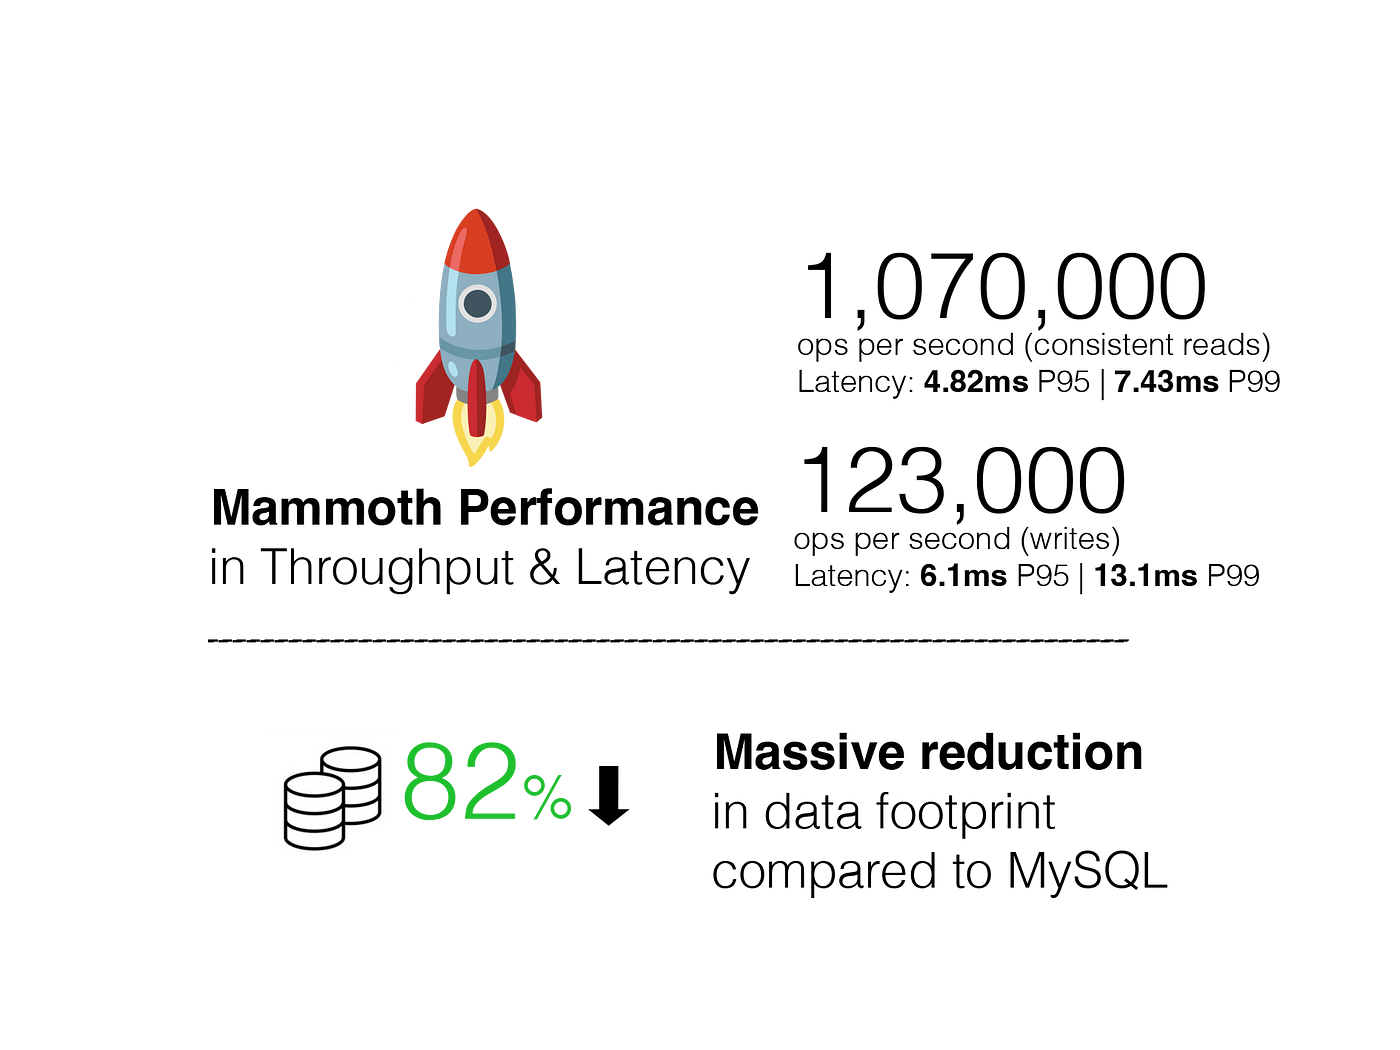
- 1M+ ops/s consistent read throughput and desirable latency < 10 ms P99.
- 100K+ ops/s write throughput and desirable latency < 20 ms P99.
Our experimental setup
The use case selected for our benchmarking is a heavy ‘Read and Write’ system. The Read workload consists of point lookups either on the primary key or on the secondary key and INSERT queries on the write workload.
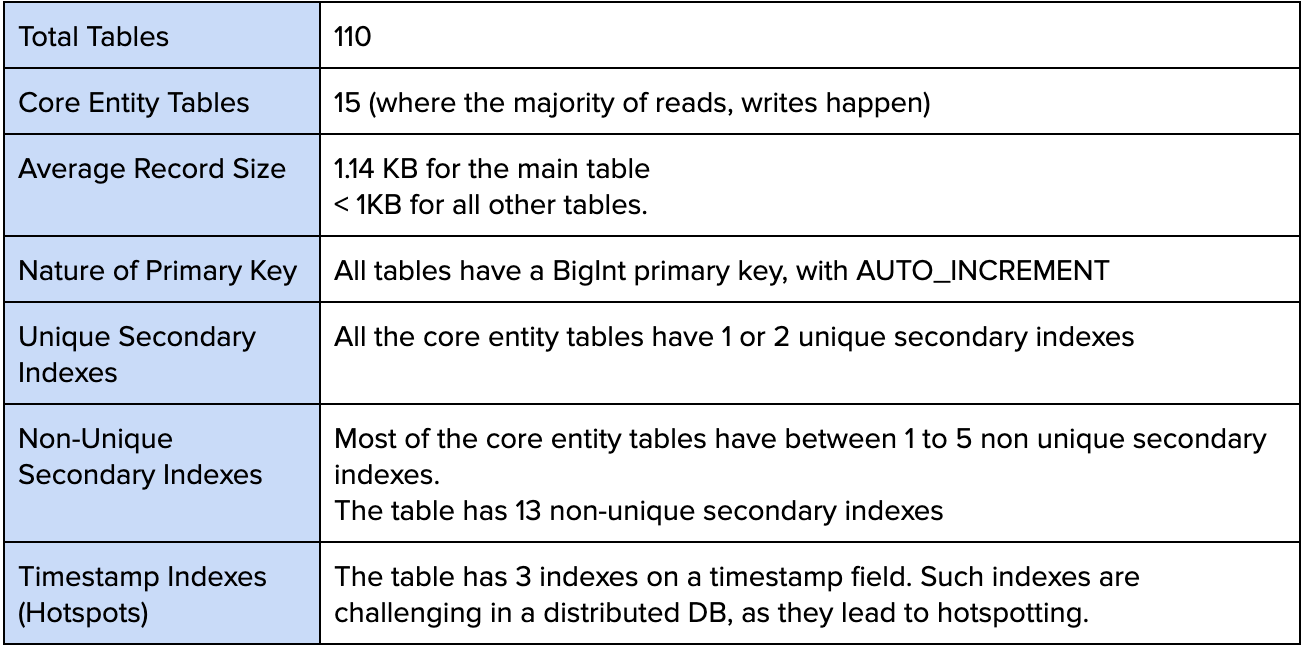
Schema Overview
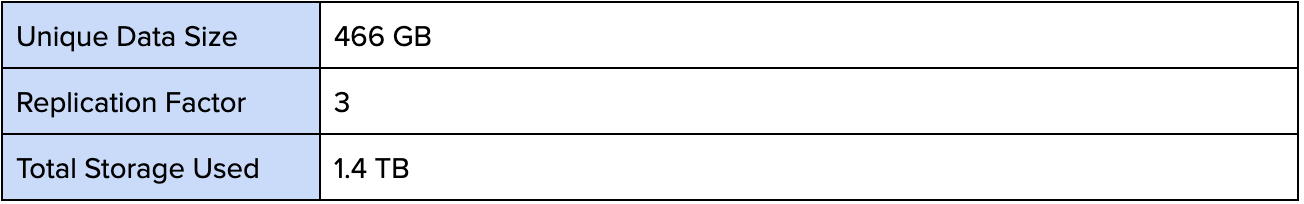
Data Footprint
Benchmark Details
Test Topology Overview
The following setup was used for benchmarking:
- The TiDB Cluster was deployed on K8s bare metals in Flipkart Private Cloud
- Stateful nodes with direct-attached NVMe SSDs.
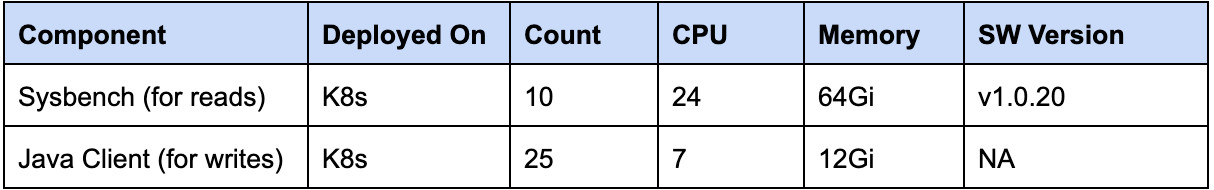
- Client load generators (Sysbench for reads and a Java app for writes) were deployed on K8s.
- The clients connect to the TiDB cluster through a TCP load balancer (Haproxy instance)

Hardware And Software Details
Database Cluster

Total Pods: 47, Total CPUs: 752, Total RAM: 2044 Gi, Total Storage: 6TB
K8s StorageClass: Direct attached NVMe SSD on Bare Metal
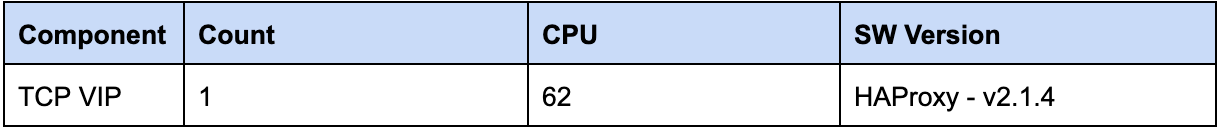
Load Balancer
Load Generator
Read Workload Details
The “Read” workload consists of a mix of 12 SELECT statements with equal weightage, without any transactions.
- The actual SELECT statements executed by the application were used.
- All are point lookups, either on the primary key or on the secondary key.
- We developed a custom Lua script for the Sysbench benchmarking tool that iterates over a list of ids in a file and fires queries to the database.
- The script is designed to use server-side prepared statements for optimal performance.
- No transactions are used while executing the SELECT queries.
Write Workload Details
The “write” workload consists of a single transaction that executes 10 INSERT statements on 5 different tables.
- The actual INSERT statements executed by the application were used.
- A custom Java application was developed to execute the transactions. The Locust tool was used to call the Java application and generate the load on the DB.
Test Plan
- Deploy TiDB v6.5.0 cluster on K8s bare metals
- Import the database from MySQL to TiDB using the TiDB-Lightning tool.
- Deploy Sysbench with the custom script for the application’s read queries.
- Run the read workload through the Sysbench client with varying concurrencies. The test runs for 30 minutes on each concurrency.
- Record throughput, P95 and P99 latencies
- Deploy a custom Java app for “write” queries
- Generate load through the locus tool with a varying number of users in a step of 50, starting from 100. The test runs for 5 minutes with each set of users.
- Record throughput, P95 and P99 latencies
Results And Inferences
Read Workload Results
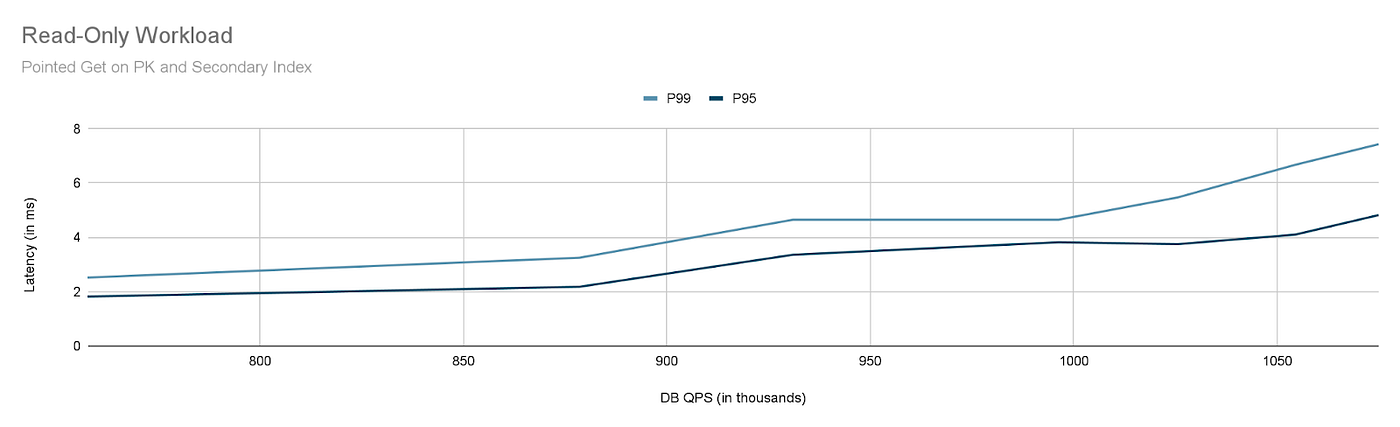
Observations:
- At 1.07 Million QPS, the P95 latency is 4.8 ms, and the P99 latency is 7.4 ms.
- The difference between P99 and P95 was constant at 1 ms below 1.07M QPS.
- Above 1.09M QPS, the difference between P99 and P95 digresses more due to high CPU utilization on the TiDB component (above 65%).
Write Workload Results

Observations
- At 123K QPS, the P95 latency is 6.1 ms and the P99 latency is 13.1 ms.
- Above ~123K QPS, due to the CPU contention on the TiKV side, P95 latency started going beyond 10 ms.
- While the throughput and latencies stated above are for individual INSERT operations, from a transaction perspective, the cluster was able to achieve ~12K TPS (10 inserts per transaction) with P95: ~50ms and P99: ~60ms.
Our Incremental Efforts and progressive learning
Our efforts towards achieving 1M QPS have seen multiple progressive findings. It is the result of several incremental efforts from various teams that came together to make it happen. Here is a quick summary of the efforts that led to this achievement.
Log Replay Approach:
In the beginning, we used mysqlslap for TiDB benchmarking. This tool captured general logs of existing MySQL and replayed queries using different concurrencies to generate load.
MySQL specific queries such as SHOW SLAVE STATUS, SHOW MASTER STATUS, as well as queries on PERFORMANCE_SCHEMA/INFORMATION_SCHEMA were not supported by TiDB. The approach resulted in a very high failure rate on these queries.
Using the log replay approach, we could reach a maximum of 152K QPS with 15ms P99 latency.
Custom Load Generator and Prepared Statements:
With our goal of 1M QPS in mind, we actively pursued opportunities to enhance performance. In line with PingCap’s recommendation, we implemented server-side prepared statements to minimize optimizer costs in query execution. We invested in writing custom code for this NFR, which can simulate the queries from the APIs.
As a first attempt, we built a Python script to be used with Locust to generate the load. However, the connection limitations in the Python connector did not allow us to generate the desired load.
In our second attempt, we leveraged the Sysbench tool, which permitted Lua scripts to generate custom loads. We developed a custom Sysbench Lua script for running the queries for our experiment.
With server-side prepared statements, the query parse time is completely reduced to 0 ms. We could achieve 156K QPS with 14 ms P99 latency.
Overcoming ELB Bottlenecks
We eliminated TCP ELB and connected sysbench clients directly to a separate TiDB. With this arrangement, we achieved 323K QPS with 65ms P99 latency.
Further, we scaled up TCP ELB resources from 3 to 12 cores. With this, we could achieve 291K QPS with 45 ms P99 latency, but the high CPU utilization challenge followed by increased latency overhead remained. We deployed our own HAProxy with the latest version to address these two challenges.
We deployed 3 HAProxies for load balancing requests to 20 TiDB PODs and used 30 Sysbench client boxes, with 10 clients connecting to each HProxy. With this setup, we could achieve 338K QPS with 125ms P99 Latency.
At this throughput, we could see TiDB pods getting bottlenecked, so we increased the TiDB pods from 20 to 30 and achieved a max QPS of 358K with 230ms P99 latency.
Packets Per Second (PPS) Limitations on K8s Nodes
Upon analysis, we discovered that certain TiKV stores were experiencing longer processing times for KV requests, resulting in high overall query latency. The issue was traced to the skewed distribution of TiKV pods on specific K8s nodes, creating a noisy neighbor problem in packet processing.
In our setup, K8s bare metal nodes have 4 cores dedicated to packet delivery. This arrangement could not scale when there was more than one Pod on the bare metal with a high network load.
We added more bare metal nodes to the cluster and ensured that different nodes scheduled different TiKV pods. In addition, with a new 62-core TCP ELB running the newer v2.1.4 version of HAProxy, we achieved 644K QPS with 3.5ms P99 and 1.9ms P95 latency.
Eliminating The ELB To Get To 1M Read QPS
We could achieve 644K read-throughput by scaling up the TCP ELB. Scaling up the QPS further using TCP ELB was challenging. We accessed TiDB through its ClusterIP service to push the benchmark further. We deployed our Sysbench tool bundled with our custom scripts on the same K8s cluster on which TiDB ran (but in a different namespace) to access this service.
We deployed 10 Sysbench pods, each with 24 vCPU and 64GB RAM. When we ran the read benchmark with 210 concurrency on each sysbench client pod, we could achieve 1.02 million read QPS with 5.47ms P99 latency and 3.75ms P95 latency.
Later, the K8s platform team addressed the PPS limitations by dedicating 16 cores for packet handling. With this added change and other improvements discussed so far, we could achieve 1.07 million read QPS with 7.43ms P99 latency and 4.82ms P95 latency.
Conclusive Remarks
- These benchmarks demonstrate that TiDB can scale to meet the performance requirements of high throughput, low latency hot stores. They go beyond the requirements of the service and demonstrate that TiDB can deliver a very high consistent read throughput of 1 Million+ QPS with a latency of ~5ms (P95).
- Whereas a high read QPS is also achievable by scaling MySQL with additional read replicas, it is qualitatively different. MySQL read replicas serve eventually consistent reads, whereas the TiDB benchmark was for consistent reads.
- The benchmarks also demonstrate that TiDB can deliver very high write throughputs of 100K+ QPS with a latency of 6.1ms (P95).
- It should be noted that these performance levels were achieved using real queries on a copy of the real data, with the real schema, including the secondary indexes. Specifically, the main entity table has 1 unique secondary index and 13 non-unique secondary indexes, of which 3 are on timestamps and prone to hot-spotting.
- It was not a part of this benchmarking exercise to scientifically quantify the horizontal scalability aspect of TiDB (we intend to take that up as a future exercise). However, our experience in getting to these throughputs validates that TiDB is horizontally scalable. Given more resources, we can deploy larger clusters of TiDB, which can deliver far higher throughputs.
- The ability to generate enough load for 1M+ QPS itself is a challenge — we had to go beyond the existing tools used for regular NFR exercises.
- The journey to 1M+ throughput with low latency uncovered bottlenecks and also led to improvements in various parts of the stack -the DB, the ELB, and network processing in the K8s nodes. Thanks to all the help and support of multiple teams that made it happen.
Source:Scaling TiDB To 1 Million QPS. A Flipkart journey | by Sachin Japate | Flipkart Tech Blog