Note:
This topic has been translated from a Chinese forum by GPT and might contain errors.
Original topic: 求大佬指导下grafana 监控项如何配置
[TiDB Usage Environment] Production Environment / Testing / POC
[TiDB Version]
[Encountered Issues]
[Reproduction Path] What operations were performed to encounter the issue
[Issue Phenomenon and Impact]
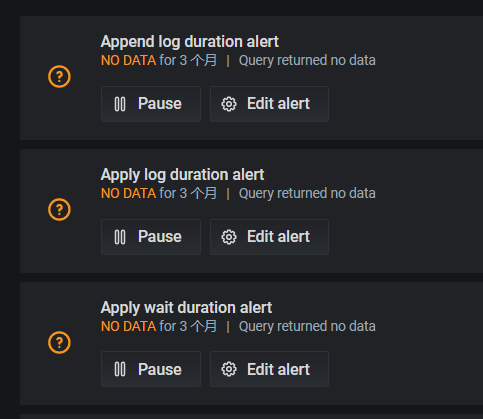
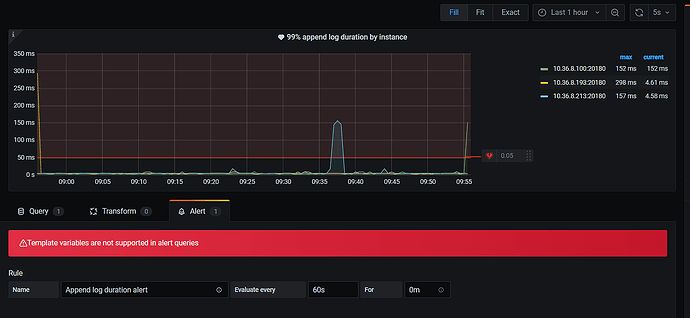
The initial Grafana monitoring of the cluster has default monitoring alert items, but each one shows “no data” (the cluster has been running for a long time and there is monitoring data). When I click in, there is an error. I searched online but didn’t find detailed explanations, just mentions of needing to modify Metrics.
I still don’t understand how to do it.
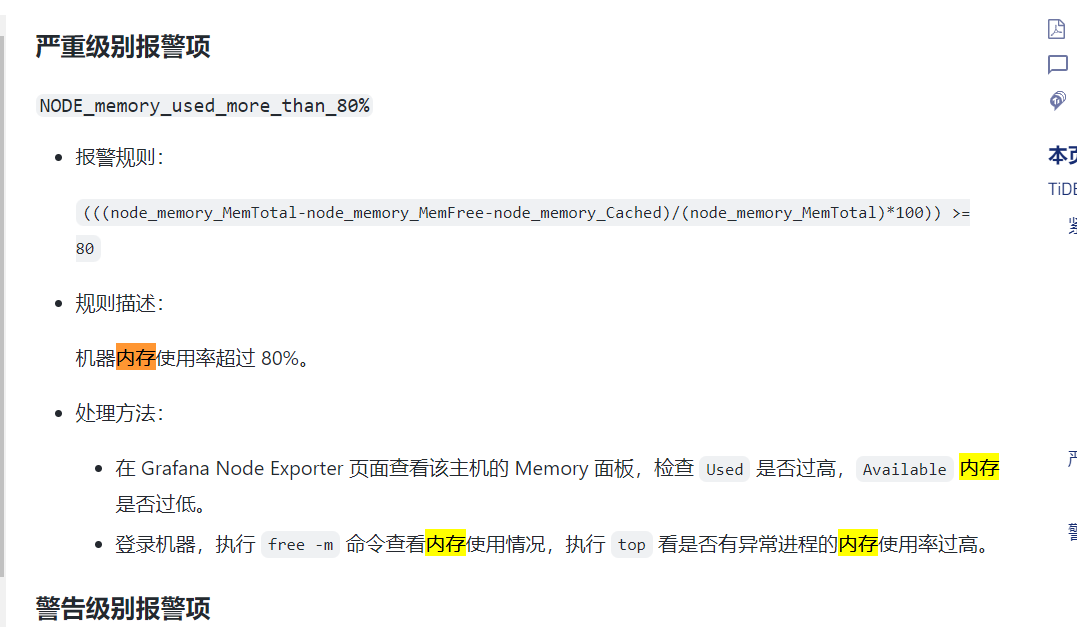
How should the SQL in metrics be written? Can I directly use the alert rules from the documentation? Also, if I want to configure an alert for memory usage of a machine in the process, which monitoring item should I go into to set the alert?
TiDB Cluster Alert Rules | PingCAP Docs

Figure 1:
- If it’s a newly started cluster and there’s no data, just wait and see;
- If not, check whether the export process of each node is normal;
Figure 2:
- There might be incorrect variable configurations in the monitoring parameters, check the parameter configurations (check if there are invalid variables or incorrect variable parameters);
Figure 3:
I’m not very sure about this alert configuration either, consult other experts.
The article mentions debugging, but the provided URL does not open.
The alert items in the configuration file are the same as those configured in the official documentation, but this alert item is actually not present in Grafana. Could you provide a screenshot of the configuration process?
I am not looking to collect Prometheus data. I want to configure monitoring alerts - specifically alerts on Grafana.
I see that the cluster is already configured, so what should I do next?
Start from here and configure as needed → alertmanager的使用_altermanger-CSDN博客

This topic was automatically closed 60 days after the last reply. New replies are no longer allowed.


