Note:
This topic has been translated from a Chinese forum by GPT and might contain errors.Original topic: select max(DateTIme) from tablename 速度慢
【TiDB Usage Environment】Production Environment
【TiDB Version】V6.5.9
【Reproduction Path】
- Slow query information
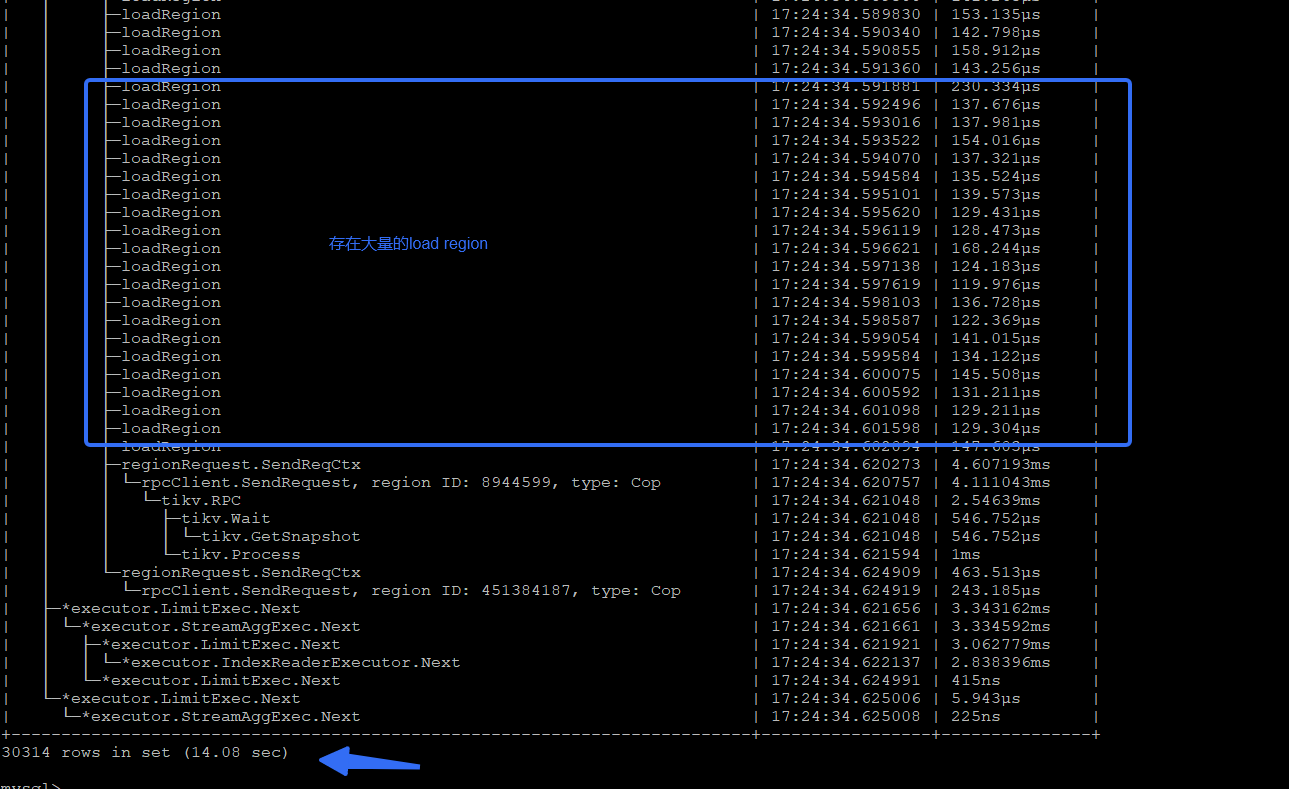
1.1 After the first connection, the first use ofselect max(datetime) from tablenamehas a delay of about 4.0 seconds
mysql>
mysql> explain analyze select max(DateTime) from TRESmartSumPer_PIT;
±-----------------------------±--------±--------±----------±---------------------------------------------------±-----------------------------------------------------------------------------------------------------------------------------------------------------------------------------------------------------------±-----------------------------------------------------------±----------±-----+
| id | estRows | actRows | task | access object | execution info | operator info | memory | disk |
±-----------------------------±--------±--------±----------±---------------------------------------------------±-----------------------------------------------------------------------------------------------------------------------------------------------------------------------------------------------------------±-----------------------------------------------------------±----------±-----+
| StreamAgg_10 | 1.00 | 1 | root | | time:954.7µs, loops:2 | funcs:max(data_pit.tresmartsumper_pit.datetime)->Column#31 | 220 Bytes | N/A |
| └─Limit_14 | 1.00 | 1 | root | | time:947.9µs, loops:2 | offset:0, count:1 | N/A | N/A |
| └─IndexReader_21 | 1.00 | 1 | root | | time:945.3µs, loops:1, cop_task: {num: 1, max: 1.53ms, proc_keys: 1, rpc_num: 1, rpc_time: 1.5ms, copr_cache_hit_ratio: 0.00, distsql_concurrency: 1} | index:Limit_20 | 331 Bytes | N/A |
| └─Limit_20 | 1.00 | 1 | cop[tikv] | | tikv_task:{time:0s, loops:1}, scan_detail: {total_process_keys: 1, total_process_keys_size: 117, total_keys: 2, get_snapshot_time: 33.4µs, rocksdb: {key_skipped_count: 2, block: {cache_hit_count: 15}}} | offset:0, count:1 | N/A | N/A |
| └─IndexFullScan_19 | 1.00 | 1 | cop[tikv] | table:TRESmartSumPer_PIT, index:DateTime(DateTime) | tikv_task:{time:0s, loops:1} | keep order:true, desc | N/A | N/A |
±-----------------------------±--------±--------±----------±---------------------------------------------------±-----------------------------------------------------------------------------------------------------------------------------------------------------------------------------------------------------------±-----------------------------------------------------------±----------±-----+
5 rows in set (3.52 sec)
1.2 SLOW log
Time: 2024-05-20T17:00:12.783209569+08:00
Txn_start_ts: 449890381783630477
User@Host: wmh[wmh] @ 192.168.202.9 [192.168.202.9]
Conn_ID: 1520453057400460761
Query_time: 3.517811043
Parse_time: 0.000059137
Compile_time: 0.000489663
Rewrite_time: 0.000393289
Optimize_time: 0.000274297
Wait_TS: 0.000011669
Cop_time: 0.000653512 Request_count: 1 Process_keys: 1 Total_keys: 2 Get_snapshot_time: 0.000 Rocksdb_key_skipped_count: 2 Rocksdb_block_cache_hit_count: 13 # DB: data_pit # Index_names: [TRESmartSumPer_PIT:DateTime]
Is_internal: false
Digest: 4274f68c3a414ba4dd783291f864a76f3ca99e415acc1fcc66acd8586bf4d232
Stats: TRESmartSumPer_PIT:449479787995725863
Num_cop_tasks: 1
Cop_proc_avg: 0 Cop_proc_addr: 10.0.3.93:20160
Cop_wait_avg: 0 Cop_wait_addr: 10.0.3.93:20160
Mem_max: 500 # Prepared: false
Plan_from_cache: false
Plan_from_binding: false
Has_more_results: false
KV_total: 0.000811246
PD_total: 3.338144114
Backoff_total: 0
Write_sql_response_total: 0.000021161
Result_rows: 0
Succ: true
IsExplicitTxn: false
IsSyncStatsFailed: false
Plan: tidb_decode_plan(‘5wWwMAk1XzEwCTAJMQlmdW5jczptYXgoZGF0YV9waXQudHJlc21hcnRzdW1wZXJfARNYZGF0ZXRpbWUpLT5Db2x1bW4jMzEJMQkBE6A6Njc3LjnCtXMsIGxvb3BzOjIJMjIwIEJ5dGVzCU4vQQoxCTE2XzE0CQFuPG9mZnNldDowLCBjb3VudDodRQgzLjIyRQAITi9BAQQgCjIJMzJfMjEJAT8waW5kZXg6TGltaXRfMgERDYEIMS4zHTwAMQFeaHBfdGFzazoge251bTogMSwgbWF4OiA4MzMuMQUrIHByb2Nfa2V5cwUdDHJwY18RKQEMBVgUIDgwMC42BS7YY29wcl9jYWNoZV9oaXRfcmF0aW86IDAuMDAsIGRpc3RzcWxfY29uY3VycmVuY3k6IDF9CTMzMT0GDDMJMTYFtAxfMAkxWggBBGt2CbUYe3RpbWU6MDVSXDF9LCBzY2FuX2RldGFpbDoge3RvdGFsXwHECGVzcxnHRhcAKF9zaXplOiAxMTcsDR4J9DwyLCBnZXRfc25hcHNob3RfBXIQIDM1LjUF8FRyb2Nrc2RiOiB7a2V5X3NraXBwZWRfKbQBPAxibG9jIV05Ew0cFDEzfX19CTG8HDQJNDZfMTkJCfVkdGFibGU6VFJFU21hcnRTdW1QZXJfUElULCAp2CBEYXRlVGltZSgRCWwpLCBrZWVwIG9yZGVyOnRydWUsIGRlc2MJMQl0ai0BIAlOL0EJTi9BCg==’)
Plan_digest: 03bb305ea548b39ba9831bbf4ff07b5c243b972a3eac7e3b835fe178efd92681
Binary_plan: tidb_decode_binary_plan(‘pQfQCqAHCgxTdHJlYW1BZ2dfMTASlQYKCExpbWl0XzE0Eq8FCg5JbmRleFJlYWRlcl8yMRLIAwoNIBgyMBKtAQoQBSBURnVsbFNjYW5fMTkh39EB6SS/ckApAAUB2PA/MAE4AkACSjYKNAoIZGF0YV9waXQSElRSRVNtYXJ0U3VtUGVyX1BJVBoUCghEYXRlVGltZRIVCuBSFWtlZXAgb3JkZXI6dHJ1ZSwgZGVzY2ocdGlrdl90YXNrOnt0aW1lOjBzLCBsb29wczoxfXD///8JAgQBeAkIDP///wFemwBUUhFvZmZzZXQ6MCwgY291bnQ6MWrKAW5gAJgsIHNjYW5fZGV0YWlsOiB7dG90YWxfcHJvY2Vzc19rZXlzOiAxLCBGFwAkX3NpemU6IDExNxEeCS1AMiwgZ2V0X3NuYXBzaG90X3QB0nwgMzUuNcK1cywgcm9ja3NkYjoge2tleV9za2lwcGVkXwmsATxAYmxvY2s6IHtjYWNoZV9oaXQRHBAxM319fVoOARg3ttv3B9I+MqkBKAFAAVIOaW5kZXg6SQYMMjBaFgWNEDY3MS4zBY0tZRRigwFjb3ApghQge251bToB8yRtYXg6IDgzMy4xBSwhEw3jGDEsIHJwY18RKQEMBVkUIDgwMC42BS4QY29wcl8ZxJhyYXRpbzogMC4wMCwgZGlzdHNxbF9jb25jdXJyZW5jeTogMX1wywIu4gFe1ABG4gEV1wgzLjIFfQnXADJaLQEYJ4eQlxsuVEItASg6ZnVuY3M6bWF4KFHcEC50cmVzQdsUc3VtcGVyQe9MLmRhdGV0aW1lKS0+Q29sdW1uIzMZggg3LjkyggA43AF4////////////ARgB’)
use data_pit;
explain analyze select max(DateTime) from TRESmartSumPer_PIT;
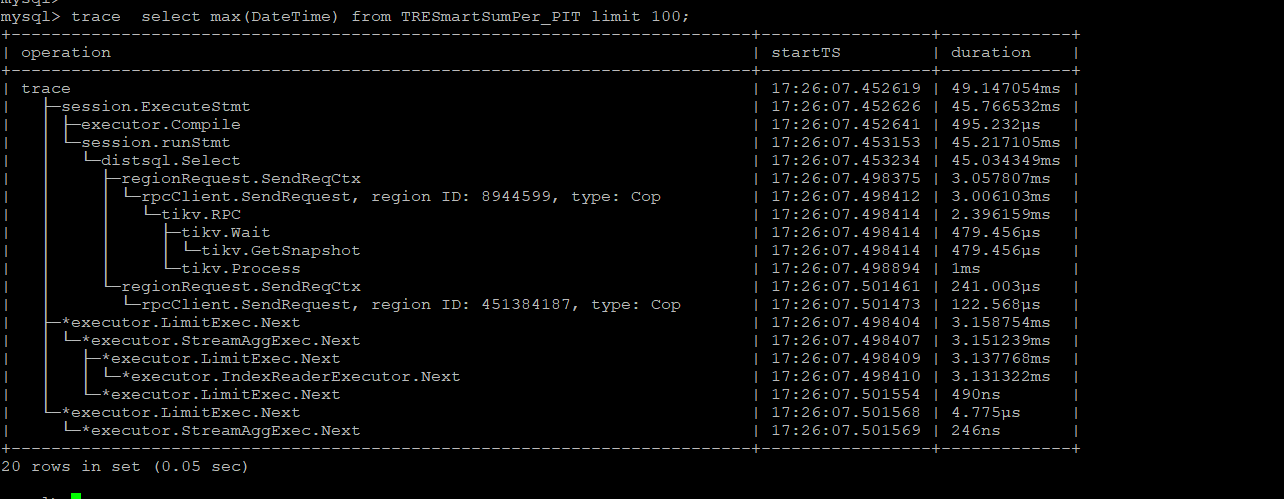
- The speed is faster when executed again
2.1 Execution plan
mysql>
mysql> explain analyze select max(DateTime) from TRESmartSumPer_PIT;
±-----------------------------±--------±--------±----------±---------------------------------------------------±------------------------------------------------------------------------------------------------------------------------------------------------------------------------------------------------------------±-----------------------------------------------------------±----------±-----+
| id | estRows | actRows | task | access object | execution info | operator info | memory | disk |
±-----------------------------±--------±--------±----------±---------------------------------------------------±------------------------------------------------------------------------------------------------------------------------------------------------------------------------------------------------------------±-----------------------------------------------------------±----------±-----+
| StreamAgg_10 | 1.00 | 1 | root | | time:1.25ms, loops:2 | funcs:max(data_pit.tresmartsumper_pit.datetime)->Column#31 | 668 Bytes | N/A |
| └─Limit_14 | 1.00 | 1 | root | | time:1.24ms, loops:2 | offset:0, count:1 | N/A | N/A |
| └─IndexReader_21 | 1.00 | 1 | root | | time:1.24ms, loops:1, cop_task: {num: 1, max: 1.19ms, proc_keys: 1, rpc_num: 1, rpc_time: 1.14ms, copr_cache_hit_ratio: 0.00, distsql_concurrency: 1} | index:Limit_20 | 338 Bytes | N/A |
| └─Limit_20 | 1.00 | 1 | cop[tikv] | | tikv_task:{time:0s, loops:1}, scan_detail: {total_process_keys: 1, total_process_keys_size: 117, total_keys: 2, get_snapshot_time: 329.4µs, rocksdb: {key_skipped_count: 2, block: {cache_hit_count: 13}}} | offset:0, count:1 | N/A | N/A |
| └─IndexFullScan_19 | 1.00 | 1 | cop[tikv] | table:TRESmartSumPer_PIT, index:DateTime(DateTime) | tikv_task:{time:0s, loops:1} | keep order:true, desc | N/A | N/A |
±-----------------------------±--------±--------±----------±---------------------------------------------------±------------------------------------------------------------------------------------------------------------------------------------------------------------------------------------------------------------±-----------------------------------------------------------±----------±-----+
5 rows in set (0.05 sec)
2.2 Corresponding slow SQL
Time: 2024-05-20T17:07:33.29944025+08:00
Txn_start_ts: 449890498175565982
User@Host: wmh[wmh] @ 192.168.202.9 [192.168.202.9]
Conn_ID: 1520453057400460761
Query_time: 0.044330099
Parse_time: 0.000025138
Compile_time: 0.000299687
Rewrite_time: 0.000249411
Optimize_time: 0.000163697
Wait_TS: 0.000005949
Cop_time: 0.000934951 Request_count: 1 Process_keys: 1 Total_keys: 2 Get_snapshot_time: 0.000 Rocksdb_key_skipped_count: 2 Rocksdb_block_cache_hit_count: 14 Rocksdb_block_read_count: 1 Rocksdb_block_read_byte: 8595 Rocksdb_block_read_time: 0.000
DB: data_pit # Index_names: [TRESmartSumPer_PIT:DateTime]
Is_internal: false
Digest: 4274f68c3a414ba4dd783291f864a76f3ca99e415acc1fcc66acd8586bf4d232
Stats: TRESmartSumPer_PIT:449479787995725863
Num_cop_tasks: 1
Cop_proc_avg: 0 Cop_proc_addr: 10.0.3.93:20160
Cop_wait_avg: 0 Cop_wait_addr: 10.0.3.93:20160
Mem_max: 1014 # Prepared: false # Plan_from_cache: false
Plan_from_binding: false # Has_more_results: false
KV_total: 0.000918619 # PD_total: 0.000004261
Backoff_total: 0
Write_sql_response_total: 0.000015934
Result_rows: 0
Succ: true
IsExplicitTxn: false
IsSyncStatsFailed: false
Plan: tidb_decode_plan(‘nQawMAk1XzEwCTAJMQlmdW5jczptYXgoZGF0YV9waXQudHJlc21hcnRzdW1wZXJfARNYZGF0ZXRpbWUpLT5Db2x1bW4jMzEJMQkBE6A6OTUzLjHCtXMsIGxvb3BzO jIJNjY4IEJ5dGVzCU4vQQoxCTE2XzE0CQFuPG9mZnNldDowLCBjb3VudDoZRQQ0OTJDAAhOL0EBBCAKMgkzMl8yMQkBPTBpbmRleDpMaW1pdF8yAREJfww0Ny41HTwAMQFcaHBfdGFzazoge251bTog MSwgbWF4OiA4NzYuNAUrIHByb2Nfa2V5cwUdDHJwY18RKQEMBVgUIDg1Ni44BS7YY29wcl9jYWNoZV9oaXRfcmF0aW86IDAuMDAsIGRpc3RzcWxfY29uY3VycmVuY3k6IDF9CTM0Nj0EDDMJMTYFtAx fMAkxWgYBBGt2CbUYe3RpbWU6MDVQXDF9LCBzY2FuX2RldGFpbDoge3RvdGFsXwHECGVzcxnHRhcAKF9zaXplOiAxMTcsDR4J9DwyLCBnZXRfc25hcHNob3RfBXIQIDMwOS4J8VRyb2Nrc2RiOiB7a2 V5X3NraXBwZWRfKbMBPQxibG9jIV45FA0cGDE0LCByZWEVLAAxDQ8wYnl0ZTogOC4zOSBLQg0UCXUoMTIuMcK1c319fQkx9Bw0CTQ2XzE5CSktZHRhYmxlOlRSRVNtYXJ0U3VtUGVyX1BJVCwgSRAgRGF0ZVRpbWUoEQlsKSwga2VlcCBvcmRlcjp0cnVlLCBkZXNjCTEJdGplASAJTi9BCU4vQQo=’)
Plan_digest: 03bb305ea548b39ba9831bbf4ff07b5c243b972a3eac7e3b835fe178efd92681
Binary_plan: tidb_decode_binary_plan('2wfQCtYHCgxTdHJlYW1BZ2dfMTASywYKCExpbWl0XzE0EucFCg5JbmRleFJlYWRlcl8yMRKABAoNIBgyMBKtAQoQBSBURnVsbFNjYW5fMTkh39EB6SS/ckApAAUB2PA/MAE4AkACSjYKNAoIZGF0YV9waXQSElRSRVNtYXJ0U3VtUGVyX1BJVBoUCghEYXRlVGltZRIVCuBSFWtlZXAgb3JkZXI6dHJ1ZSwgZGVzY2ocdGlrdl90YXNrOnt0aW1lOjBzLCBsb29wczoxfXD///8JAgQBeAkIDP///wFemwBUUhFvZmZzZXQ6MC