Note:
This topic has been translated from a Chinese forum by GPT and might contain errors.
Original topic: TIDB批量插入慢
[TiDB Usage Environment] Online
[TiDB Version] v6.1.0
[Encountered Issue]
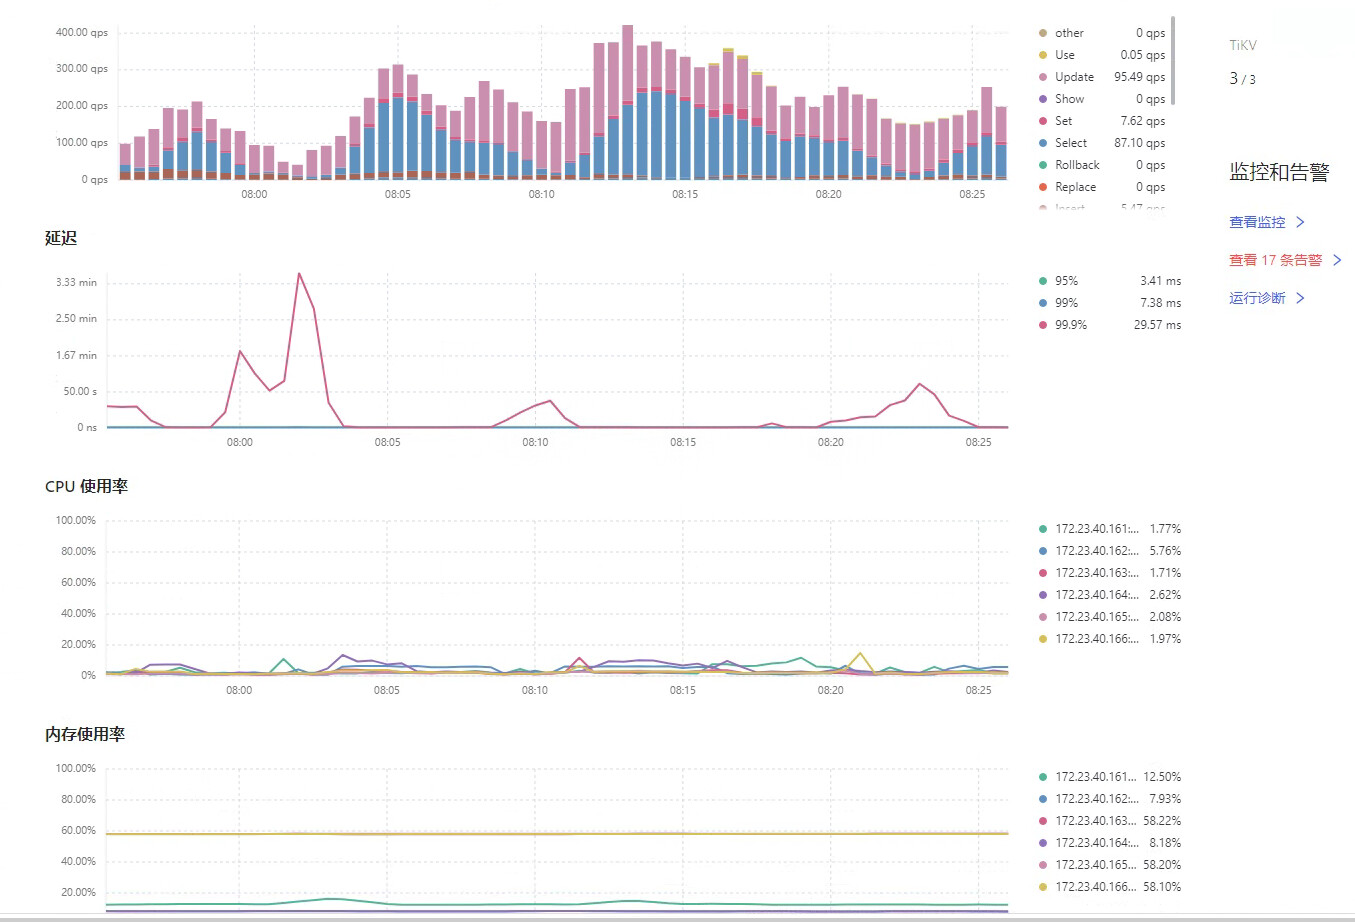
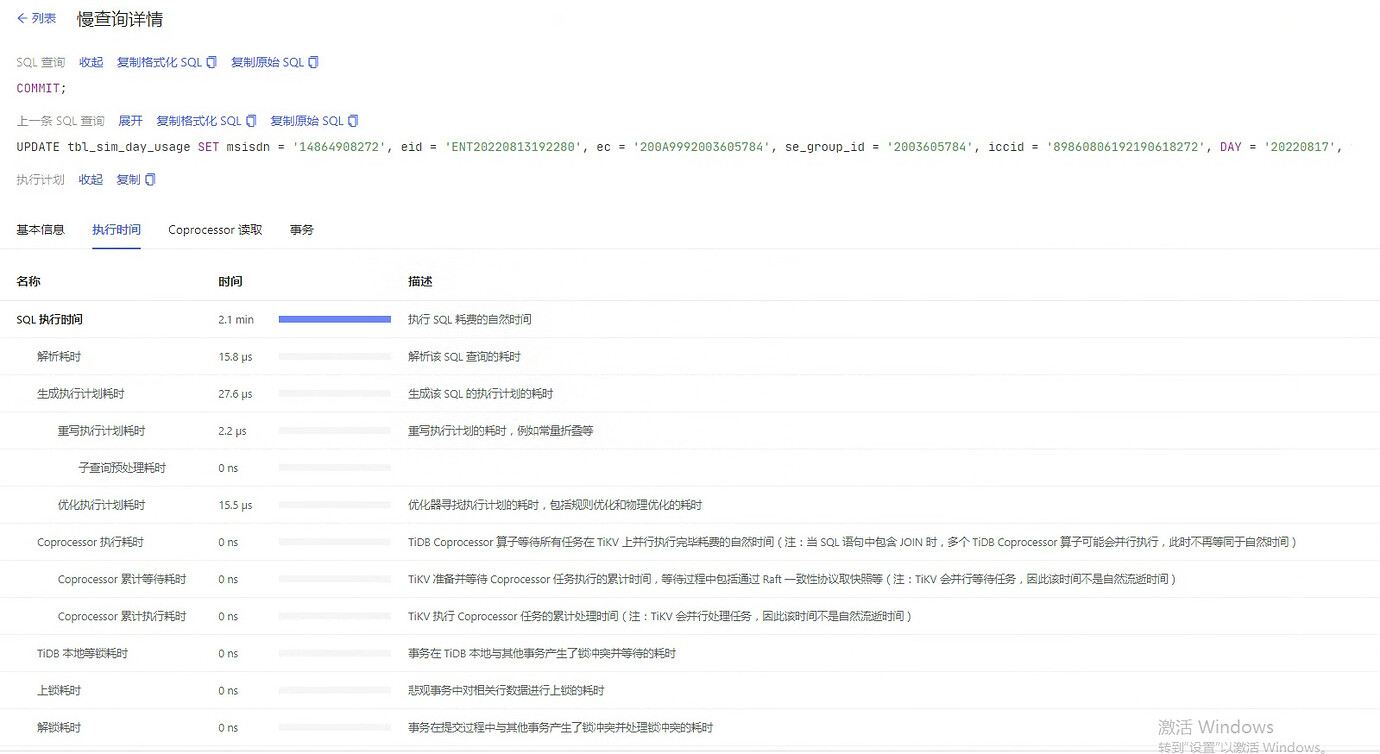
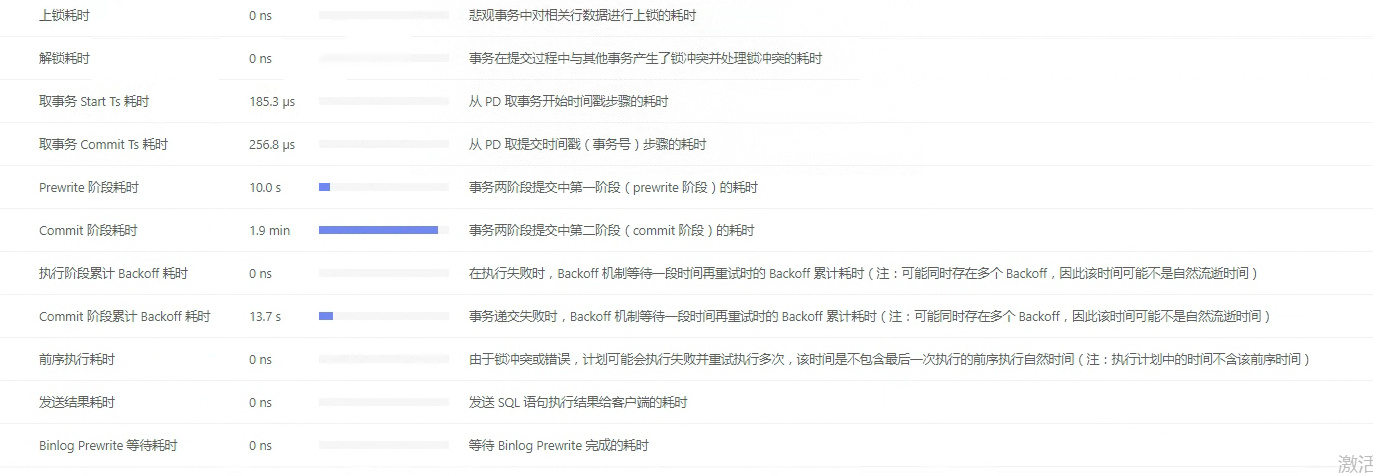
Machine configuration: tikv 8c 32G. The main scenario involves batch insert and batch update, with 500 records per batch. Initially, the insertion speed is acceptable, around 10 seconds for 2000 records. However, after running for a while, it becomes increasingly slow, and only a direct tikv restart restores the normal speed. Observing the slow queries, the main time consumption is during the commit phase, with most of the time spent on prewrite and commit stages. The cluster load appears to be low.
[Issue Phenomenon and Impact]
[Attachments]
Could you provide the complete update statement and the related table structure?
Additionally, after restarting TiKV, the write speed returned to normal.
After restarting, does it slow down again after a while? Initially, it’s fast because everything is written to the memtable, and only the WAL is persisted to disk. Later, when flushing and compacting, the disk I/O increases, which likely causes higher latency. Confirm if this is the case. If you have physical machine monitoring, check the trend of disk I/O.
One question is, if it’s during disk write operations, the disk I/O should be relatively high. In fact, when the write speed is slow, the overall load is not high.
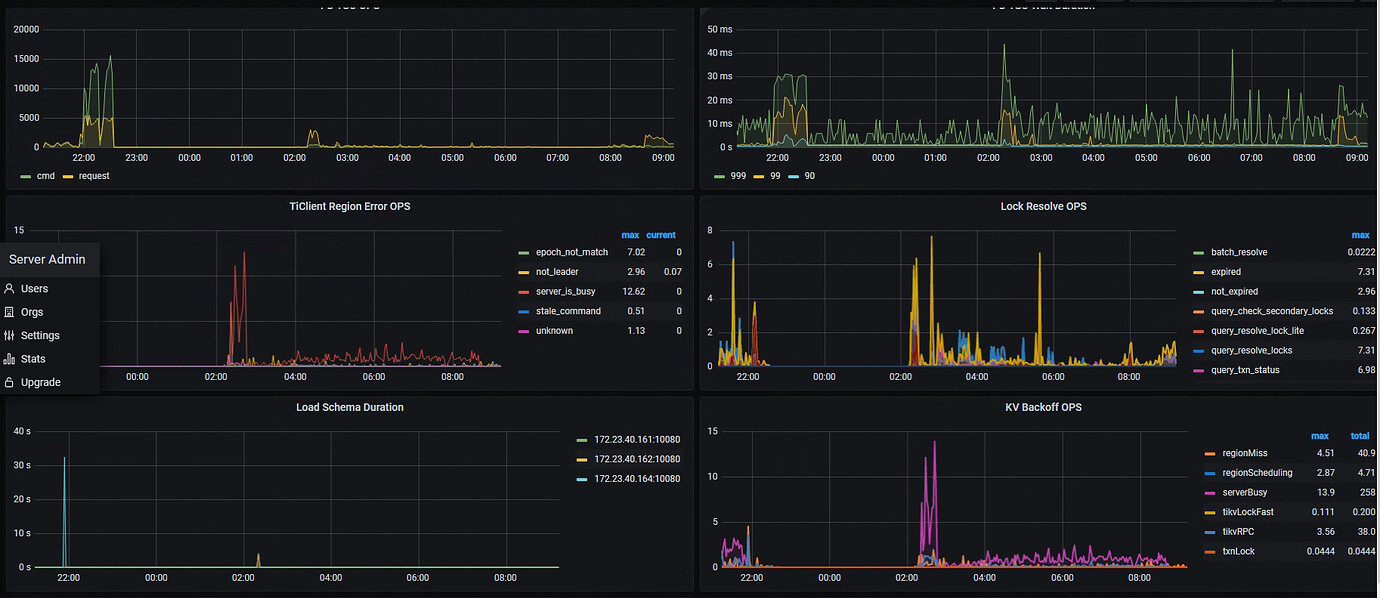
If it’s confirmed that disk I/O hasn’t increased, then it’s not the issue I mentioned. This problem needs to be analyzed through monitoring. If you post the entire monitoring data, there should be some kind-hearted people who will take a look for you. If you post a long screenshot, I might take a look. If you export the metrics, I don’t have a Grafana environment here, and importing it once is quite troublesome, so you’ll have to wait for other kind-hearted people to help you out. 
The image is not available for translation. Please provide the text content directly.
Take a look at Grafana, there are fewer things on the dashboard.
The image is not visible. Please provide the text you need translated.
The image link you provided appears to be broken or inaccessible. Please provide the text you need translated.
The image cannot be translated directly. Please provide the text content for translation.
The image is not visible. Please provide the text content for translation.
I can’t view images directly. Please provide the text you need translated.
Is it because TiKV memory is full?
The monitoring doesn’t show it’s full.
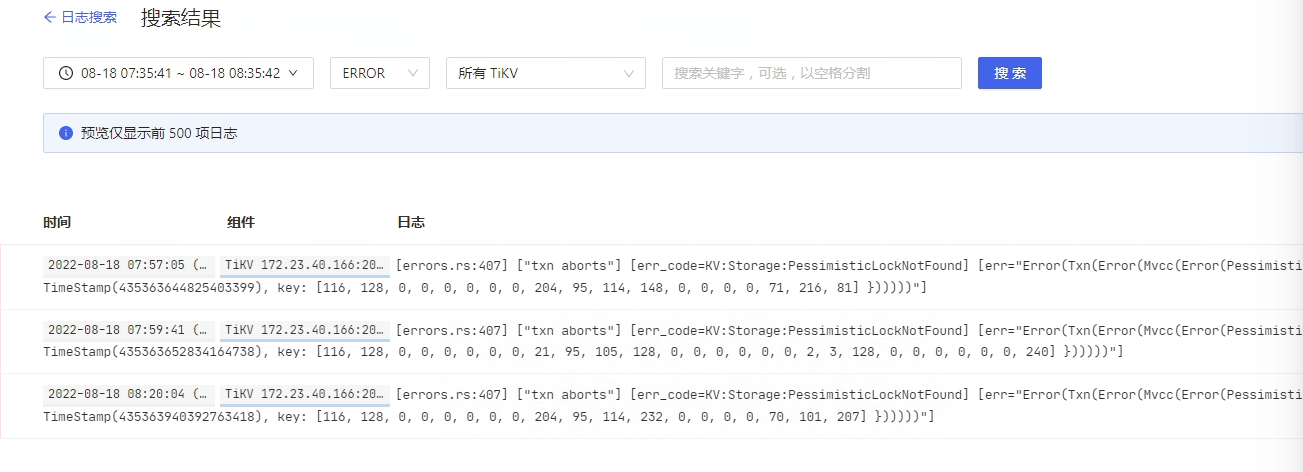
Check if there is a lock.
The network speed is up to more than 30Mb.