Note:
This topic has been translated from a Chinese forum by GPT and might contain errors.Original topic: tidb并发查询慢
[TiDB Usage Environment] Production Environment / Testing / PCO
[TiDB Version] 5.7.25-TiDB-v6.1.0
[Encountered Problem]
SQL statement:
select
  T_58CD4F.`branch_name` as `__fcol_0`,
  sum(T_58CD4F.`number`) as `__fcol_1`
from (SELECT
    DISTINCT
        d.lines_name,
        d.branch_name,
        d.shop_name,
    di.delivery_id,
    di.sku,
        di.number
from (
        SELECT
                d.delivery_id,
                d.lines_name,
                b.`name` AS branch_name,
                s.`name` AS shop_name,
        d.erpsource
        FROM
                erp_sdb_wms_delivery d
                LEFT JOIN erp_sdb_ome_branch b ON b.branch_id = d.branch_id AND b.erpsource = d.erpsource
                LEFT JOIN erp_sdb_ome_shop s ON s.shop_id = d.shop_id AND s.erpsource = d.erpsource
        WHERE
                delivery_time BETWEEN UNIX_TIMESTAMP('2021-01-01') and  UNIX_TIMESTAMP(DATE_ADD('2022-08-01',INTERVAL 1 DAY ))
        ) d join ( SELECT delivery_id, bn AS sku, erpsource, number FROM erp_sdb_wms_delivery_items
     WHERE 1=1
     and bn in ('SOUFEEL_22','BZD008') ) di
          ON di.delivery_id = d.delivery_id and di.erpsource=d.erpsource
) as `T_58CD4F`
where 1 = 1
group by T_58CD4F.`branch_name`
[Problem Phenomenon and Impact]
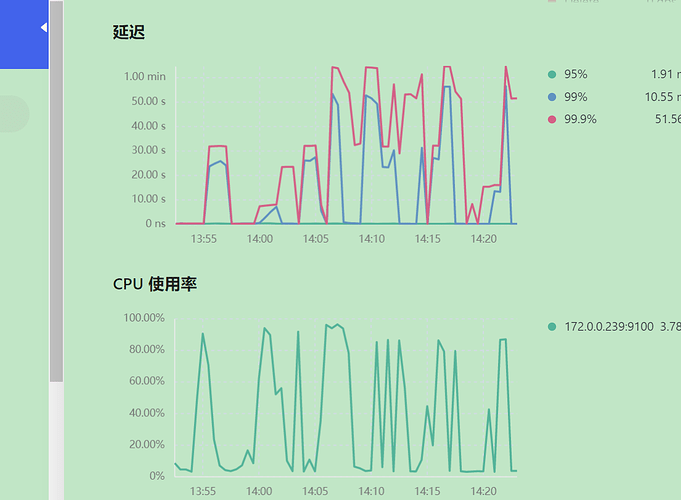
Executing the SQL statement alone takes 7.3 seconds, but when multiple concurrent executions of this SQL statement occur, the time taken reaches 32 seconds. Observing the dashboard page, the CPU usage increases.
Please advise on how to improve query performance when facing multiple concurrent executions.
Slow log information:
# Time: 2022-09-07T11:50:36.185994767+08:00
# Txn_start_ts: 435820324708679681
# User@Host: root[root] @ 125.211.72.217 [125.211.72.217]
# Conn_ID: 3894492175815148323
# Query_time: 35.214570341
# Parse_time: 0.000344403
# Compile_time: 0.003411279
# Rewrite_time: 0.001141417
# Optimize_time: 0.001980015
# Wait_TS: 0.0000225
# Cop_time: 176.960387282 Process_time: 415.196 Wait_time: 269.759 Request_count: 2527 Process_keys: 4548617 Total_keys: 6660728 Rocksdb_delete_skipped_count: 932 Rocksdb_key_skipped_count: 5938109 Rocksdb_block_cache_hit_count: 30499722
# DB: bdata
# Index_names: [erp_sdb_wms_delivery:ind_delivery_time,erp_sdb_wms_delivery_items:ind_bn_status_code]
# Is_internal: false
# Digest: 3c42814a7dd1f443ae3da83f3924bc91f62b04865bacd82f2f3438be6f3c09c6
# Stats: erp_sdb_wms_delivery:435525279461408769,erp_sdb_ome_branch:pseudo,erp_sdb_wms_delivery_items:435803349122547715,erp_sdb_ome_shop:pseudo
# Num_cop_tasks: 2527
# Cop_proc_avg: 0.164303917 Cop_proc_p90: 0.607 Cop_proc_max: 2.341 Cop_proc_addr: 172.0.0.239:20160
# Cop_wait_avg: 0.106750692 Cop_wait_p90: 0.221 Cop_wait_max: 0.443 Cop_wait_addr: 172.0.0.239:20160
# Mem_max: 63699047
# Prepared: false
# Plan_from_cache: false
# Plan_from_binding: false
# Has_more_results: false
# KV_total: 699.761262391
# PD_total: 0.000010866
# Backoff_total: 0
# Write_sql_response_total: 0.000005886
# Result_rows: 3
# Succ: true
# IsExplicitTxn: false

