Note:
This topic has been translated from a Chinese forum by GPT and might contain errors.
Original topic: 慢日志 build_task_duration 2秒
[TiDB Usage Environment] Production Environment / Testing / PoC
[TiDB Version] 7.5.1
[Reproduction Path] Operations performed that led to the issue
[Encountered Issue: Problem Phenomenon and Impact]
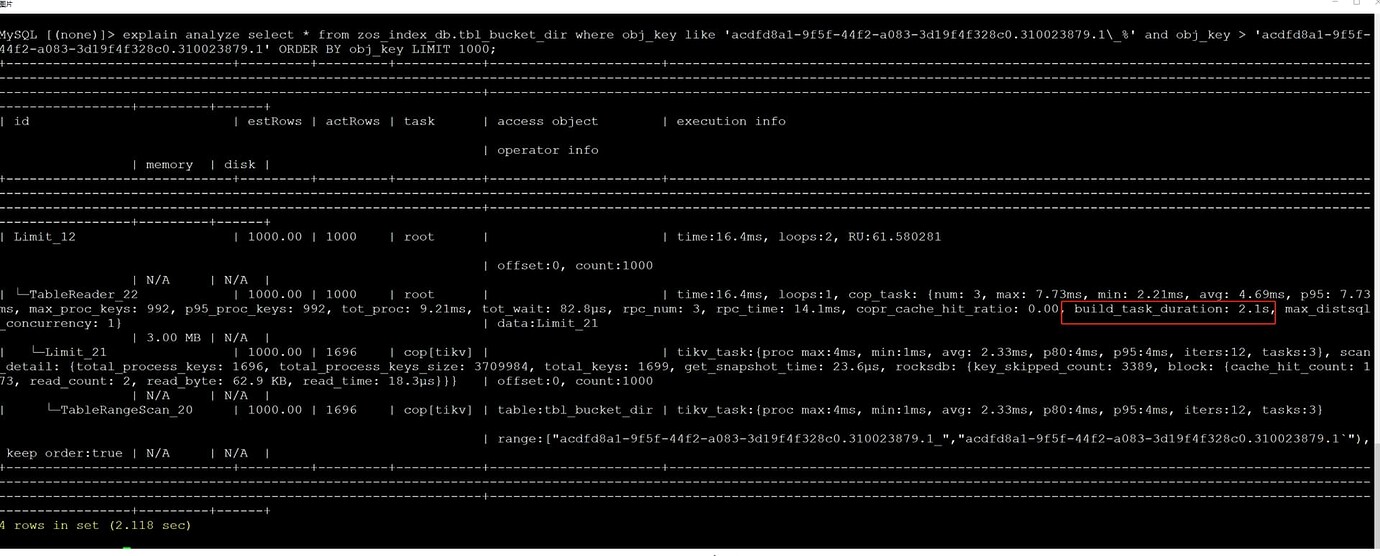
The cluster has very low pressure, almost no pressure. There are 3 TiKV machines, each with 4 TiKV processes, 4 SSD disks, 500G memory, and 56 physical cores. The cluster has 1.5T of data. A single scan query for 1000 rows of data took 2 seconds, and the second query took 70ms.
[Resource Configuration] Go to TiDB Dashboard - Cluster Info - Hosts and take a screenshot of this page
[Attachments: Screenshots/Logs/Monitoring]
What does build_task_duration mean?
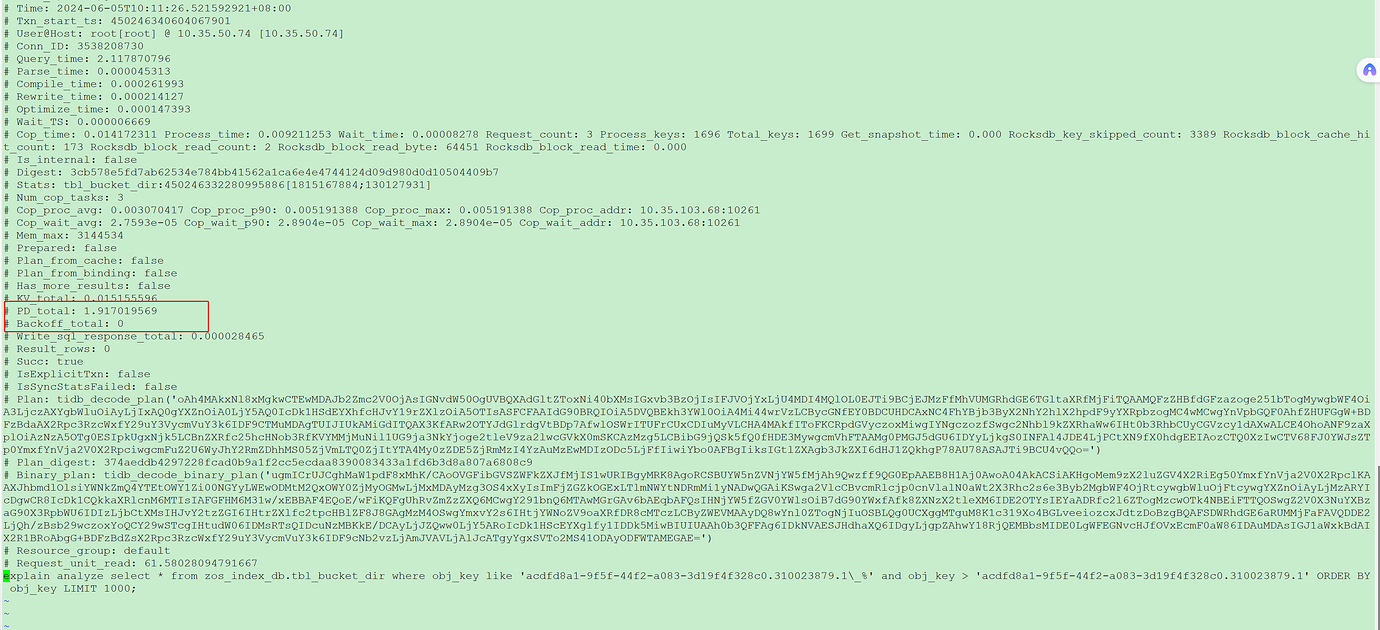
The slow log shows that pd_total takes a lot of time:
PD_total: Indicates the total time spent on all RPC requests on PD for this statement. The second time querying some information will be stored in the TiDB cache, so it will be faster.
PD_total: Indicates the total time spent on all RPC requests on PD for this statement.
If PD_total takes a long time, you can check whether it is due to slow network transmission with PD.
build_task_duration: Indicates the duration of the build task, i.e., the time taken to execute the build task. This time usually includes various operations required to execute the build plan, such as scanning tables, building indexes, preparing data, etc.
TiKV cache, right? There shouldn’t be any difference in PD_total between the first and second queries; the difference is just that the second query hits the TiKV memory. From the execution plan, the block hit difference between the first and second queries is not significant.
Can this SQL still be reproduced now? How about checking the resource usage of PD at the corresponding time?
The second query should hit the cache, so it’s relatively fast.
PD is very busy or TiDB, the bandwidth between PDs is insufficient, otherwise the time spent on building or processing tasks would not need to be so long.
How many regions does this table have?
[Resource Allocation] Go to TiDB Dashboard - Cluster Info - Hosts and take a screenshot of this page
Let’s take a look at your deployment situation~
If it’s hot data, try adding a cache to see if it solves the problem.