Note:
This topic has been translated from a Chinese forum by GPT and might contain errors.
Original topic: sql响应时间慢
【TiDB Usage Environment】Production
【TiDB Version】v4.0.10
【Encountered Problem】Overall increase in SQL response time for the cluster
【Problem Phenomenon and Impact】
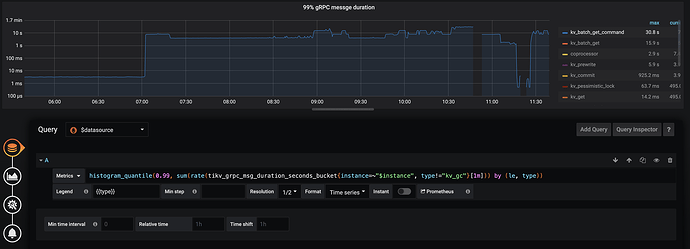
Business feedback indicates SQL timeout. Checking the information_schema.cluster_slow_query table reveals that the long-running SQL queries are using unique keys (uk). Monitoring shows that the 99% gRPC message duration for kv_batch_get_command is significantly higher, normally in milliseconds but has risen to seconds.
Machine load has not reached a bottleneck.
【Attachments】
All components are version v4.0.10.
Version, SQL, table structure, execution plan, problem symptoms, and whether there are any abnormal monitoring indicators. Please provide detailed information.
Hmm, editing in progress.
Trace the SELECT statement to see which part is consuming the most time?
https://metricstool.pingcap.com/#backup-with-dev-tools Export the overview, \tidb\pd\tikv detail\ monitoring according to this. Make sure to click expand and wait for all panels to load the data completely before exporting.
±-----------------------------------------±----------------±-------------+
| operation | startTS | duration |
±-----------------------------------------±----------------±-------------+
| trace | 15:46:27.532819 | 201.281889ms |
| ├─session.Execute | 15:46:27.532825 | 508.492µs |
| │ ├─session.ParseSQL | 15:46:27.532831 | 31.272µs |
| │ ├─executor.Compile | 15:46:27.532894 | 348.389µs |
| │ └─session.runStmt | 15:46:27.533256 | 52.253µs |
| └─*executor.BatchPointGetExec.Next | 15:46:27.533348 | 200.51194ms |
| └─rpcClient.SendRequest | 15:46:27.533389 | 200.391491ms |
±-----------------------------------------±----------------±-------------+
Boss, please check if this has any data.
No, the exported file is at least a few megabytes.
I remember there was an optimization for point get in version 4.0.9. Before version 4.0.8, casting would not occur, but it does in 4.0.9. Check if the type of your index column matches the type you are passing.
They are all numeric types, no implicit conversion.
There are quite a few monitoring items, and the laptop’s memory might not be sufficient. Could you please export some of the necessary monitoring panels?
At 7:00, there was a sudden increase in ops usage, which coincides with the grpc message time. Is this normal? Check the thread CPU, disk IO, and network latency in the TiKV monitoring. Also, is this cluster running on a laptop?
This “use” should be “use db”. The SQL timeout application should have retries, and the number of connections has also increased. After creating a new connection, use db, and then query data.
No, I checked the Prometheus monitoring on the laptop. The cluster is running on physical machines with a configuration of 64 cores and 256GB memory, across 4 physical machines.
The CPU utilization of the 40th TiKV thread is very high, and from the curve, it is consistent with the use in ops. Export the TiDB server monitoring data and take a look.
From 7:00 to 7:01, there was an increase in KV requests, and subsequently, the duration started to rise. Check if there are any large queries during this time period.
There are no large queries, and non-system query statements. During the time period from 06:55:00 to 07:05:00, the slow query with the maximum memory usage (Mem_max) observed was 335400.
Currently, it has been identified that the leading column field of the unique key (UK) has low distinctiveness.
For example:
UK (col1, col2, col3)
col1 is a grouping field, col2 is a status field, and col3 is a user ID field.
In terms of distinctiveness, col3 is the highest and col2 is the lowest.
SQL:
SELECT * FROM table WHERE col1 IN (1001) AND col2 IN (1, 2, 3, 4) AND col3 = 155246852;


