This documented is translated from https://asktug.com/t/topic/603527
GC mechanism
For details, please refer to the official website document Introduction to GC Mechanism
Diagnostic tools
1. Important monitoring indicators
GC Tasks & GC Tasks duration: The number of GC tasks processed by gc_worker and the time spent executing GC tasks.
- total-gc: Total number of GC tasks. Each GC task will clean up the keys of a region waiting for GC (effective when the compaction filter is turned off).
- skipped-gc/failed-gc: skipped GC tasks and failed GC tasks (valid when compaction filter is turned off). During GC, based on the meta-information recorded by rocksdb, regions that do not have many versions to be cleaned can be skipped.
- total-unsfe_destroy_range: The number of UnsafeDestroyRange tasks called during the Delete Ranges phase.
- total-orphan_versions / total-gc_keys: GC task initiated by compaction filter, used to process data that cannot be directly cleaned by compaction filter.
Auto GC Progress: The progress of each TiKV Do GC stage (valid when the compaction filter is turned off).
- During each round of GC TiKV scan data, the progress will increase from 0 to 100%. This indicator is only a rough calculation and may be slower than TiDB’s GC cycle. If TiKV GC is inactive, the progress will be 0.
Auto GC SafePoint: The safepoint used by each TiKV Do GC stage. This safepoint is obtained regularly from PD by each TiKV.
GC Speed: The number of keys deleted per second during GC. It is valid whether the compaction filter is enabled or not.
GC scan write details / GC scan default details: Operation events counted by RocksDB iterators during GC scan, divided into write CF and default CF, similar to the Coprocessor - Total Ops Details by CF indicator.
GC in Compaction Filter: The number of filtered versions in the compaction filter of write CF.
- filtered: The number of all keys filtered out during compaction. Types include put, delete, rollback, lock, etc.
- rollback/lock: The number of rollback and lock keys included in the keys filtered during compaction. Rollback/lock keys are only special keys generated when transactions are rolled back and selected for update, and do not represent actual data.
2. System table mysql.tidb
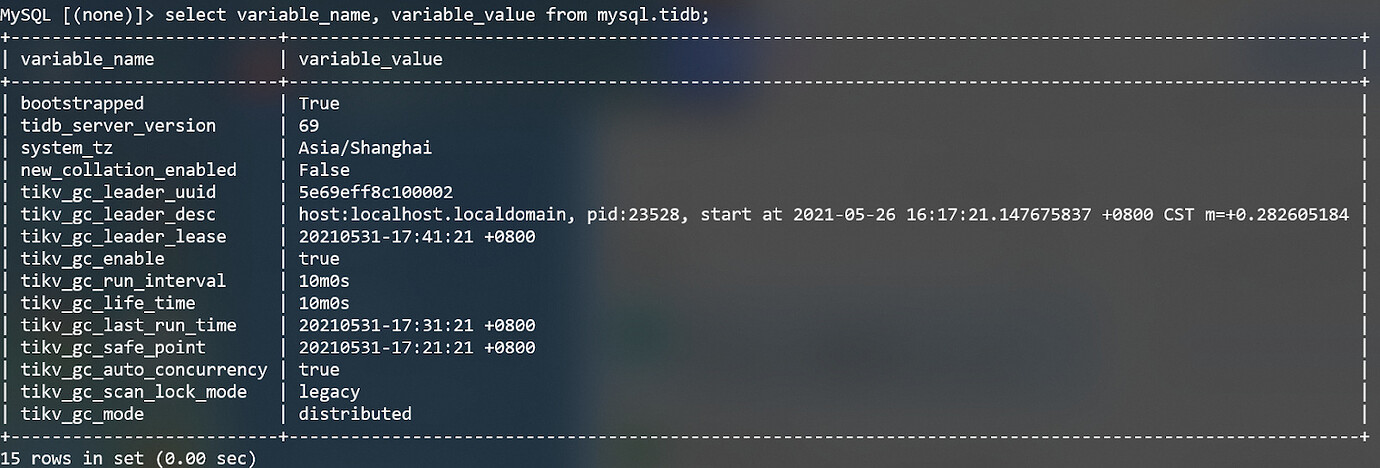
The variables starting with tikv_gc are all related to GC. Among them, tikv_gc_leader_uuid/tikv_gc_leader_desc/tikv_gc_leader_lease is used to record the status of GC leader. tikv_gc_safe_point and tikv_gc_last_run_time will be automatically updated before the start of each round of GC. Several other variables are configurable, see GC configuration .
Note : Starting from 5.0, it is recommended to set parameters such as tidb_gc_life_time through set variables instead of directly modifying update mysql.tidb to avoid modifying parameters in the wrong format and causing GC abnormality.
3. GC leader log
Find the TiDB node where the leader is located through the tikv_gc_leader_desc field of the mysql.tidb table, and then filter the logs with the gc_worker keyword.
grep "gc_worker" tidb.log | less
4. CLI commands
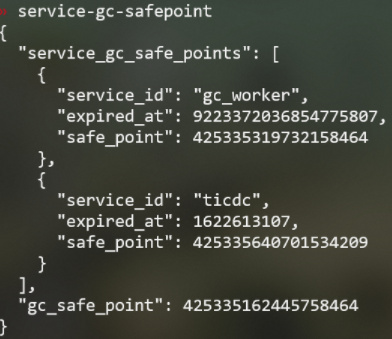
pd-ctl service-gc-safepoint queries the gc safepoint of all services.
- “service_gc_safe_points”: the safe points recorded by each service such as gc_worker/ticdc/br/dumpling.
- “gc_safe_point”: The safe point used to notify TiKV to perform Do GC. This safe point does not guarantee that data after this time can be safely read.
How to determine the stage of GC
GC is divided into three stages: Resolve Locks, Delete Ranges and Do GC.
Resolve Locks phase: A large number of scan_lock requests will be generated on the TiKV side, which can be observed in gRPC-related metrics. The scan_lock request will be called for all Regions.
Delete Ranges stage: A small number of unsafe_destroy_range requests will be sent to TiKV, or there may not be any. This can be observed in gRPC related metrics and GC - GC tasks.
Do GC phase: Each TiKV detects by itself whether the safe point recorded by the PD is updated. If it is updated, a GC operation will be performed (different versions have different behaviors). At the same time, the GC leader can continue to trigger the next round of GC, so the execution process of this phase is It is asynchronous with other stages. You can judge whether you are in this stage through the monitoring indicators on the TiKV - Details page:
- When closing the compaction filter, judge it by total-gc in GC - GC Tasks
- When the compaction filter is turned on, it is judged by GC - GC in Compaction Filter
- Whether the compaction filter is enabled or not, it can be judged by GC - GC Speed.
Common GC issues
1. Main phenomena
- safe point does not advance for a long time
- Disk space has not been recovered after dropping table
2. Possible reasons
- Variables such as gc_life_time have incorrect formats
- Uncommitted long transaction block GC
- safe_point block GC of some services
- Resolve Locks failed
- Increase GC life time from a smaller value
- GC runs slowly but normally
- Variables such as gc_life_time or gc_run_interval are set too large
3. Troubleshooting
Check the GC leader log for relevant errors and determine the possible causes. Take the following error reports as examples:
- Case1: Error Failed to parse duration “time: unknown unit “min"in duration"10min””
The parameter format is wrong. gc_life_time was mistakenly changed to 10min. It should be changed to 10m.
- Case2: error gc safepoint blocked by a running session
The transaction block GC has not been committed. Find the block session through show processlist or information_schema.cluster_processlist.
- Case3: Error: there’s another service in the cluster requires an earlier safe point
For the safe_point block GC of some services, find the block service through pd-ctl service-gc-safepoint.
- Case4: error resolve locks failed
It is usually caused by Region unavailable. Use grep -E “gc_worker range_task” tidb.log to query the relevant error logs to troubleshoot the cause of Region unavailable.
- Case5: The last safe point in the log is later than current one. No need to gc
After increasing the GC life time, the safe point is recalculated in the new round of GC, and a time is obtained that is earlier than the safe point of the last GC, so there is no need to perform GC. This situation does not need to be handled.
GC impact on performance
If monitoring observes periodic jitters in Duration that are consistent with the GC operating cycle, you can determine that GC has impacted performance.
After the compaction filter is turned on by default in version 5.0, the impact of GC on performance is significantly reduced. When similar problems occur, first check whether the compaction filter is turned on. For version 4.x, you can try setting GC flow control Reduce the impact on performance.
Note: The v5.1.3/v5.2.3/v5.3.0 version has fixed multiple bugs in the compaction filter GC working mechanism and the batch client layer. It is recommended to upgrade to a newer release version before turning on the compaction filter.
Precautions
When you encounter situations where you need to recover accidentally deleted data or investigate data corruption issues (such as data index inconsistency), you may need to temporarily increase the gc life time to avoid historical data being cleaned, for example
update mysql.tidb set variable_value = "1000h" where variable_name = "tikv_gc_life_time"set @@global.tidb_gc_life_time = "1000h"
After solving the problem, don’t forget to modify the variables back to their previous values to avoid retaining too much historical data and affecting business query performance.