Note:
This topic has been translated from a Chinese forum by GPT and might contain errors.Original topic: 【 SOP 系列 41 】TiDB 集群安装 TiDB Dashboard
Thanks to @清风明月 for the contribution.
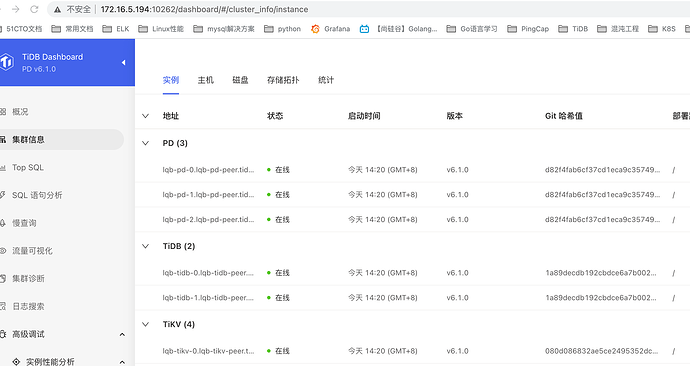
TiDB Dashboard is a visual panel introduced from TiDB 4.0, used to help observe and diagnose the entire TiDB cluster. For details, see TiDB Documentation - TiDB Dashboard. This article will introduce how to access TiDB Dashboard in a Kubernetes environment. By creating a Dashboard, you can quickly view cluster issues, and it is recommended to enable it.
1. Accessing TiDB Dashboard
Method 1: Access using NodePort Service
1.1 Create a NodePort Service
[root@k8s-master tidb]# cat lqb-nodeport.yaml
apiVersion: v1
kind: Service
metadata:
  name: access-dashboard
  namespace: tidb ## Replace with the actual namespace
spec:
  ports:
  - name: dashboard
    port: 10262
    protocol: TCP
    targetPort: 10262
  type: NodePort
  selector:
    app.kubernetes.io/component: discovery
    app.kubernetes.io/instance: yz  #### Replace with the cluster name
    app.kubernetes.io/name: tidb-cluster
1.2 If there are more than one PD, add the following configuration
  pd:
    baseImage: pingcap/pd
    config: |
      [dashboard]
        internal-proxy = true
    replicas: 3
    requests:
      cpu: "100m"
      storage: 12Gi
    mountClusterClientSecret: false
    storageClassName: "local-storage-monitoring"
Method 2: Access via port forwarding
[root@k8s-master tidb]# kubectl port-forward --address 0.0.0.0 svc/lqb-discovery 10262:10262 -ntidb
Forwarding from 0.0.0.0:10262 -> 10262

Then IP:10262/dashboard
http://172.16.5.194:10262/dashboard
Method 3: Access via ingress proxy
[root@k8s-master tidb]# cat ingress-dashboard.yaml
apiVersion: networking.k8s.io/v1
kind: Ingress
metadata:
  name: lqb-yz-dashboard
  namespace: tidb
spec:
  rules:
    - host: "lqb.mytest.org"
      http:
        paths:
        - path: "/dashboard"
          pathType: Prefix
          backend:
            service:
              name: lqb-discovery
              port:
                number: 10262
After deploying Ingress, you can access TiDB Dashboard outside the Kubernetes cluster via http://${host}/dashboard.
2. Enable Continuous Performance Analysis (TidbNGMonitoring CR)
Deploy TidbNGMonitoring CR
[root@k8s-master tidb]# cat tidbngmonitoring-yz.yaml
apiVersion: pingcap.com/v1alpha1
kind: TidbNGMonitoring
metadata:
  name: tidbngmonitoring-yz
  namespace: tidb
spec:
  clusters:
  - name: yz
    namespace: tidb
  configUpdateStrategy: RollingUpdate
  ngMonitoring:
    requests:
      storage: 10Gi
    version: v6.1.0
    storageClassName: local-storage
Apply the configuration file
[root@k8s-master tidb]# kubectl apply -f tidbngmonitoring-yz.yaml
tidbngmonitoring.pingcap.com/tidbngmonitoring-yz created
Enable Continuous Performance Analysis
-
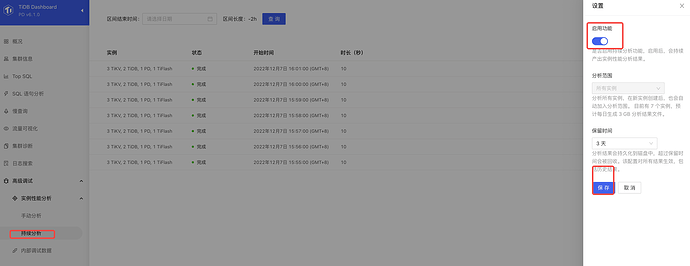
Enter TiDB Dashboard, select Advanced Debugging > Profiling Instances > Continuous Profiling.
-
Click Open Settings. On the right-side Settings page, turn on the switch under Enable Feature. Set the Retention Period or keep the default value.
-
Click Save.

