Note:
This topic has been translated from a Chinese forum by GPT and might contain errors.
Original topic: sql执行报错
[TiDB Usage Environment] Production Environment / Testing / Poc
Production Environment
[TiDB Version]
5.2.1
[Reproduction Path] What operations were performed when the issue occurred
In the production environment, there is a scenario where multiple table joins are queried and written, with approximately 20 million records. Currently, executing this results in an error:
2013 - Lost connection to server at ‘handshake: reading initial communication packet’, system error: 0. Upon checking the monitoring, it was found that the pressure was too high, causing some nodes to automatically restart and leading to connection drops. I would like to ask if there are any good methods for TiDB debugging in this scenario, aside from optimizing SQL and splitting tasks. (Currently, there are quite a few background scheduling tasks in the cluster, and the IO is consistently high)
[Encountered Issues: Phenomenon and Impact]
[Resource Configuration]
[Attachments: Screenshots/Logs/Monitoring]
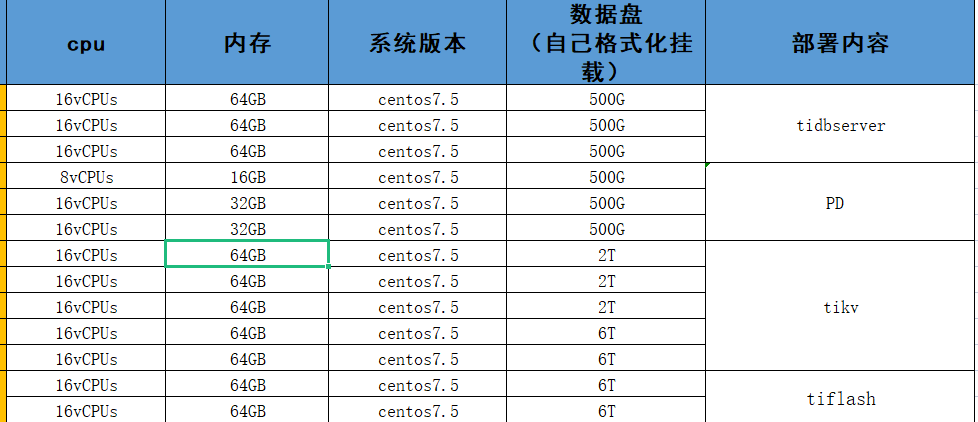
Please provide the configuration information of the previous cluster.
[Resource Configuration] This is not available, lacking a basis for judgment.
[Reproduction Path] How is the 20 million data associated and queried, and how is it written? Can you provide the structure, statements, and execution plan?
What type of disk is it? Why do TiKV nodes need to be configured with different sizes? 
I saw your big SQL, do you want to run it all in one transaction?
Could you export your cluster configuration file for us to take a look? Does this SQL require sorting, and is the memory allocated to TiDB sufficient?
Take a look at the startup times of each component, it’s highly likely an OOM issue.
SELECT * FROM information_schema.cluster_info;
Your query must have exhausted the memory! Didn’t the last monitor show an instance reaching over 60GB? You can insert in batches.
 This is due to insufficient resources. The 6T below was originally TiFlash, which I expanded into a TiKV node. The disk is just a regular disk on Huawei Cloud, with average performance. This large SQL has now been split into multiple executions.
This is the initial configuration modified by the previous DBA, and it has hardly been changed since. Please help check if there are any areas that can be adjusted or modified.
Yes, I saw from the dashboard that the component was also restarted recently.
The disk IO is not sufficient, we can only reduce the read frequency, otherwise the IO will be overwhelmed.
172.21.10.137
172.21.10.138
What are these two nodes? Not only is the IO high, but the CPU and memory are also very high.
The TiKV node’s hardware is not keeping up. 
I think we should start by optimizing slow SQL queries, as OOM is generally caused by large result sets. If the optimization doesn’t meet expectations, then consider scaling up. If the data volume is large and there is high concurrency, regular hard drives definitely won’t suffice. SSDs are basically the standard.
Adjust the hardware configuration of the disk; other optimizations are unlikely to have good results. Alternatively, lower your expectations… 
Yes, this is the current approach.
This topic was automatically closed 60 days after the last reply. New replies are no longer allowed.


