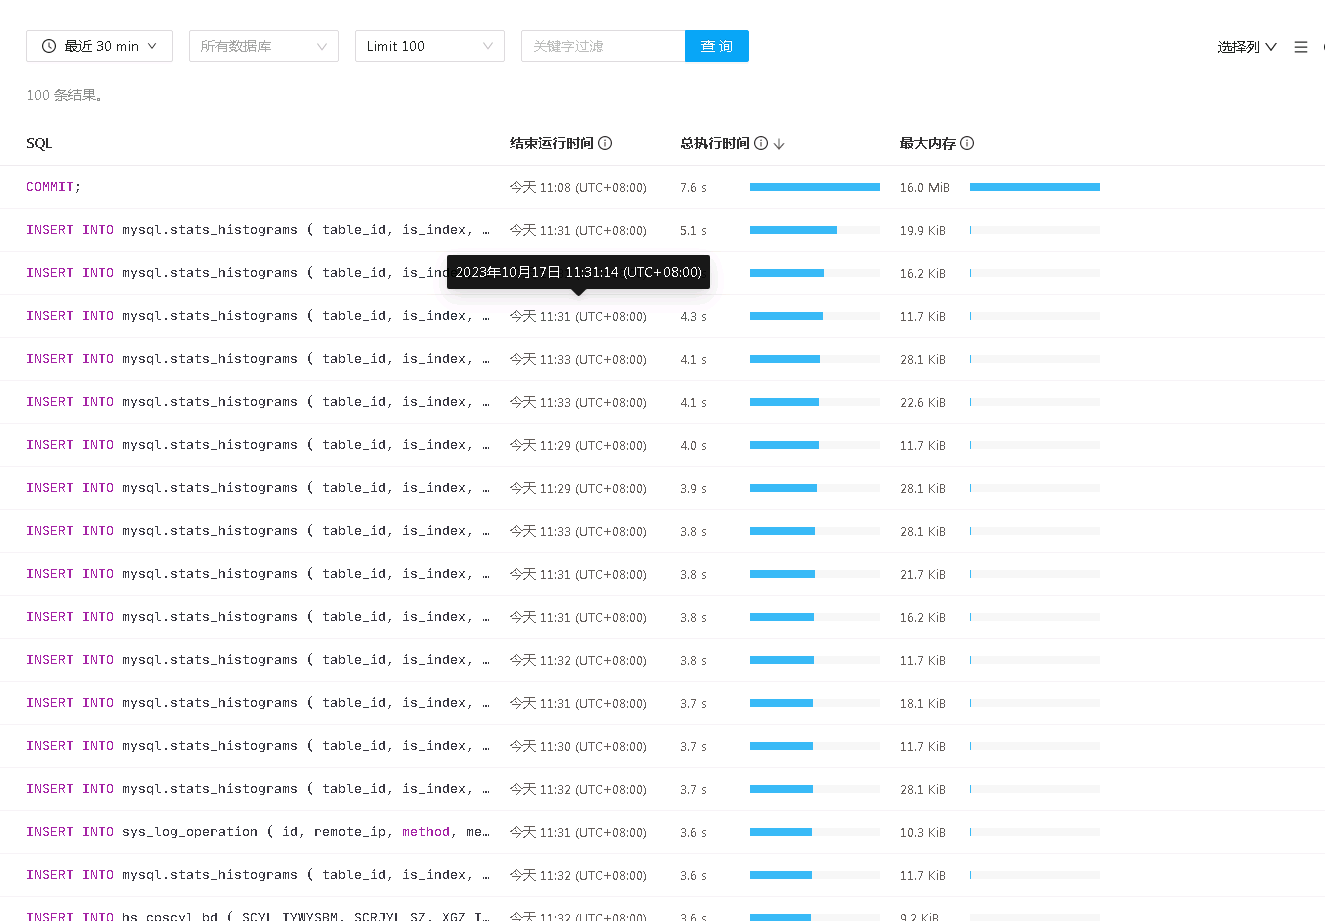
Sudden Surge of Slow SQL: INSERT INTO mysql.stats_histograms

Note:
This topic has been translated from a Chinese forum by GPT and might contain errors.

Original topic: 突然出现大量慢SQL,INSERT INTO mysql.stats_histograms

| username: 你说嗨我说拜

[TiDB Usage Environment] Production Environment / Testing / PoC
[TiDB Version] 6.5.3
[Encountered Problem: Phenomenon and Impact]
A large number of slow SQL queries suddenly appeared.

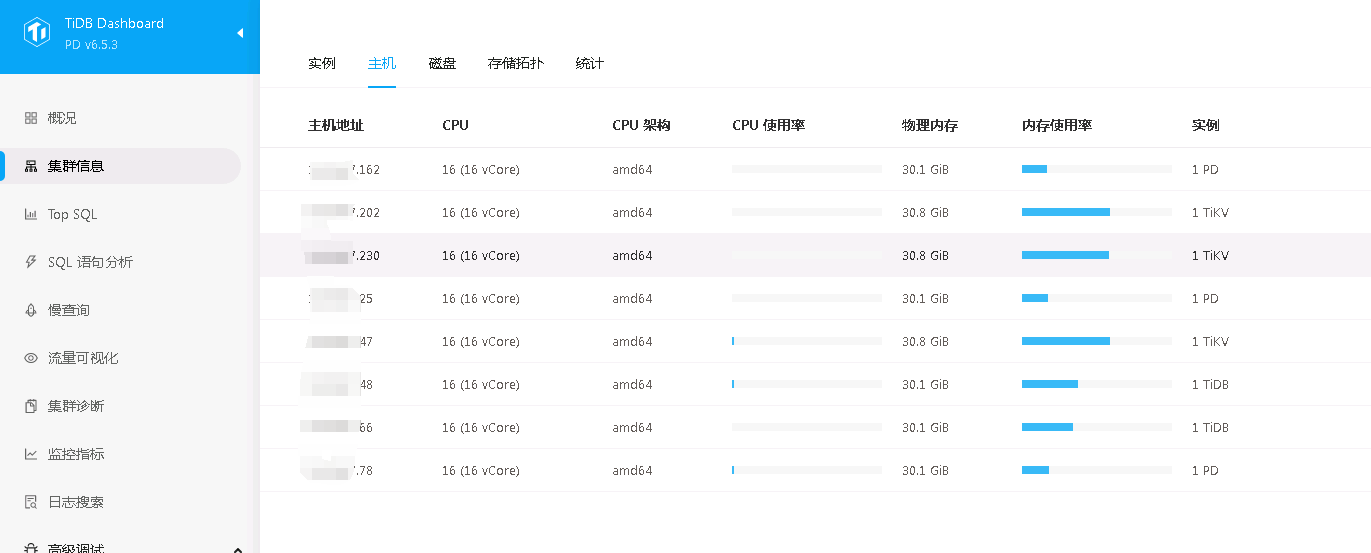
[Resource Configuration] Go to TiDB Dashboard - Cluster Info - Hosts and take a screenshot of this page

[Attachments: Screenshots/Logs/Monitoring]

| username: 你说嗨我说拜 | Original post link

Do any of you know the reason?

| username: 路在何chu | Original post link

Post the execution plan and let’s take a look.

| username: 你说嗨我说拜 | Original post link

id task estRows operator info actRows execution info memory disk
Insert_1 root 0 N/A 0 time:1.85ms, loops:1, prepare: 47µs, check_insert: {total_time: 1.8ms, mem_insert_time: 292.6µs, prefetch: 1.51ms, rpc:{BatchGet:{num_rpc:2, total_time:1.43ms}, tikv_wall_time: 721.3µs, scan_detail: {total_process_keys: 26, total_process_keys_size: 2080, total_keys: 26, get_snapshot_time: 39.5µs, rocksdb: {block: {cache_hit_count: 108}}}}}, commit_txn: {prewrite:2.8s, get_commit_ts:237.1µs, commit:2.3s, slowest_prewrite_rpc: {total: 2.800s, region_id: 116045, store: 10.18.67.47:20160, tikv_wall_time: 2.8s, scan_detail: {get_snapshot_time: 15.9µs, rocksdb: {block: {cache_hit_count: 69}}}, write_detail: {store_batch_wait: 934.2ms, propose_send_wait: 0s, persist_log: {total: 1.87s, write_leader_wait: 642.4ms, sync_log: 1.22s, write_memtable: 6.21µs}, commit_log: 1.87s, apply_batch_wait: 41.1µs, apply: {total:231.5µs, mutex_lock: 0s, write_leader_wait: 0s, write_wal: 41.1µs, write_memtable: 54.8µs}}}, commit_primary_rpc: {total: 2.299s, region_id: 116045, store: 10.18.67.47:20160, tikv_wall_time: 2.3s, scan_detail: {get_snapshot_time: 21.2µs, rocksdb: {block: {}}}, write_detail: {store_batch_wait: 1.12s, propose_send_wait: 0s, persist_log: {total: 1.18s, write_leader_wait: 543.6ms, sync_log: 633.2ms, write_memtable: 5.02µs}, commit_log: 1.18s, apply_batch_wait: 34.5µs, apply: {total:220µs, mutex_lock: 0s, write_leader_wait: 0s, write_wal: 34.5µs, write_memtable: 76.8µs}}}, region_num:1, write_keys:13, write_byte:1170} 11.9 KB N/A
| username: zhanggame1 | Original post link

Is this table updating statistics? Have you done table analysis?

| username: 你说嗨我说拜 | Original post link

I haven’t done it, just running normally.

| username: Fly-bird | Original post link

The mysql.stats_histograms stores statistical information about tables (such as the number of distinct values and NULL values in indexes and data columns), which can help optimize the performance of SQL queries.

| username: songxuecheng | Original post link

This should be fine, it might be caused by locks.

| username: tidb菜鸟一只 | Original post link

No, it’s not just that. A commit taking 7.5 seconds? Was the cluster almost down at that time? It must be that the IO was completely dead for a commit to take more than 7 seconds, right?

| username: 你说嗨我说拜 | Original post link

There was a period of high IO.

| username: 你说嗨我说拜 | Original post link

The disk performance is still not very good, which has an impact.

| username: TiDBer_小阿飞 | Original post link

Is the mysql.stats_histograms table a status histogram? Why would there be an insertion for this?

| username: xingzhenxiang | Original post link

Is internal statistical information affecting normal use?

| username: tidb菜鸟一只 | Original post link

Moreover, looking at the details of your execution plan, most of the time is stuck on flushing to disk. You should first check if there is an issue with the disk. Poor disk performance shouldn’t cause flushing to take this long; there must be some malfunction…

| username: 你说嗨我说拜 | Original post link

Boss, how should this be detected? Please guide me. :pray:

| username: 像风一样的男子 | Original post link

What kind of disk is it? It can’t be a mechanical disk, right?

| username: 你说嗨我说拜 | Original post link

The image cannot be translated directly. Please provide the text content for translation.

| username: tidb菜鸟一只 | Original post link

Test the I/O situation on the corresponding disk:

time dd if=/dev/zero of=test bs=8k count=100000 oflag=direct
| username: 路在何chu | Original post link

You can check the monitoring item tidb-nova-prod-Disk-Performance to see the IO situation.