Note:
This topic has been translated from a Chinese forum by GPT and might contain errors.
Original topic: titan疑似出现磁盘空间泄露
[TiDB Usage Environment] Production Environment
[TiDB Version] 5.3.2
[Reproduction Path] Operations performed that led to the issue
[Encountered Issue: Problem Phenomenon and Impact]
The actual estimated space usage for the business is approximately 500GB, but TiKV has already occupied 18TB. The entire cluster has Titan enabled, with large values, and most of the data is in Titan. The entire LSM tree data is very small, with the total number of SST files being less than 80, but Titan occupies 18TB. A manual full compaction has been performed, and the titan.discardable-ratio has been changed to 0.1, but the overall cluster size has only reduced by 1TB, currently still occupying 17TB.
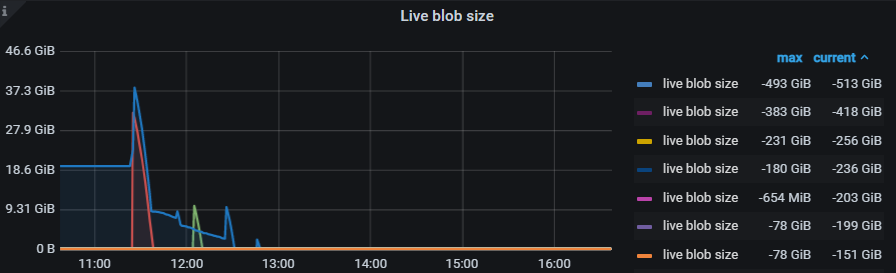
The Live Blob Size monitoring item in TiKV’s TitanDB-Kv is a bit strange, all values are negative, around -200GB.
Is there any way to troubleshoot this, or perform an overall cleanup of Titan?
[Resource Configuration]
[Attachments: Screenshots/Logs/Monitoring]
Check the TiKV node logs.
Check if the gc advancement time point in the TiKV control panel is normal.
The gc safepoint on the TiKV monitoring panel indeed hasn’t changed, but the safepoint in autogc in the tikv.log has changed.
There are indeed logs in the TiDB code indicating “gc safepoint blocked by a running session,” but we suspect this is caused by inactive client connections. This cluster currently has very little access, but I see that the code for calculating minstartTs has a logic that determines a maximum validity period of 24 hours.
Although there are logs indicating that the GC safepoint is blocked by a running session, the safepoint changes daily. However, the safepoint on the TiKV monitoring panel does not change. The TiKV logs also confirm this:
[2022/12/25 15:29:49.079 +08:00] [INFO] [gc_manager.rs:433] [“gc_worker: auto gc starts”] [safe_point=438275696821796872]
[2022/12/25 15:29:49.501 +08:00] [INFO] [gc_manager.rs:472] [“gc_worker: auto gc finishes”] [processed_regions=13666]
[2022/12/25 21:39:42.536 +08:00] [INFO] [gc_manager.rs:433] [“gc_worker: auto gc starts”] [safe_point=438291223833477130]
[2022/12/25 21:39:43.050 +08:00] [INFO] [gc_manager.rs:472] [“gc_worker: auto gc finishes”] [processed_regions=13666]
I just confirmed that the safepoint on the monitoring panel not changing is due to a configuration issue with Grafana monitoring. Prometheus shows that the safepoint is progressing, but since the cluster is not very active, the safepoint advances only once or twice a day. However, I suspect this has little to do with the issue. For this cluster, we do not modify the data after it is written; subsequent operations are all queries.
There may be deviations in the monitoring statistics of live blob size, which can be ignored. Take a look at the live blob file size and the Blob file discardable ratio distribution in the monitoring. Also, check how the configuration is set.
This topic was automatically closed 60 days after the last reply. New replies are no longer allowed.