Note:
This topic has been translated from a Chinese forum by GPT and might contain errors.
Original topic: sync_diff_inspector对比数据,提示Region is unavailable
【TiDB Usage Environment】Production Environment
【TiDB Version】V5.3.3
【Reproduction Path】sync_diff_inspector comparing disaster recovery environment data
【Encountered Problem: Problem Phenomenon and Impact】
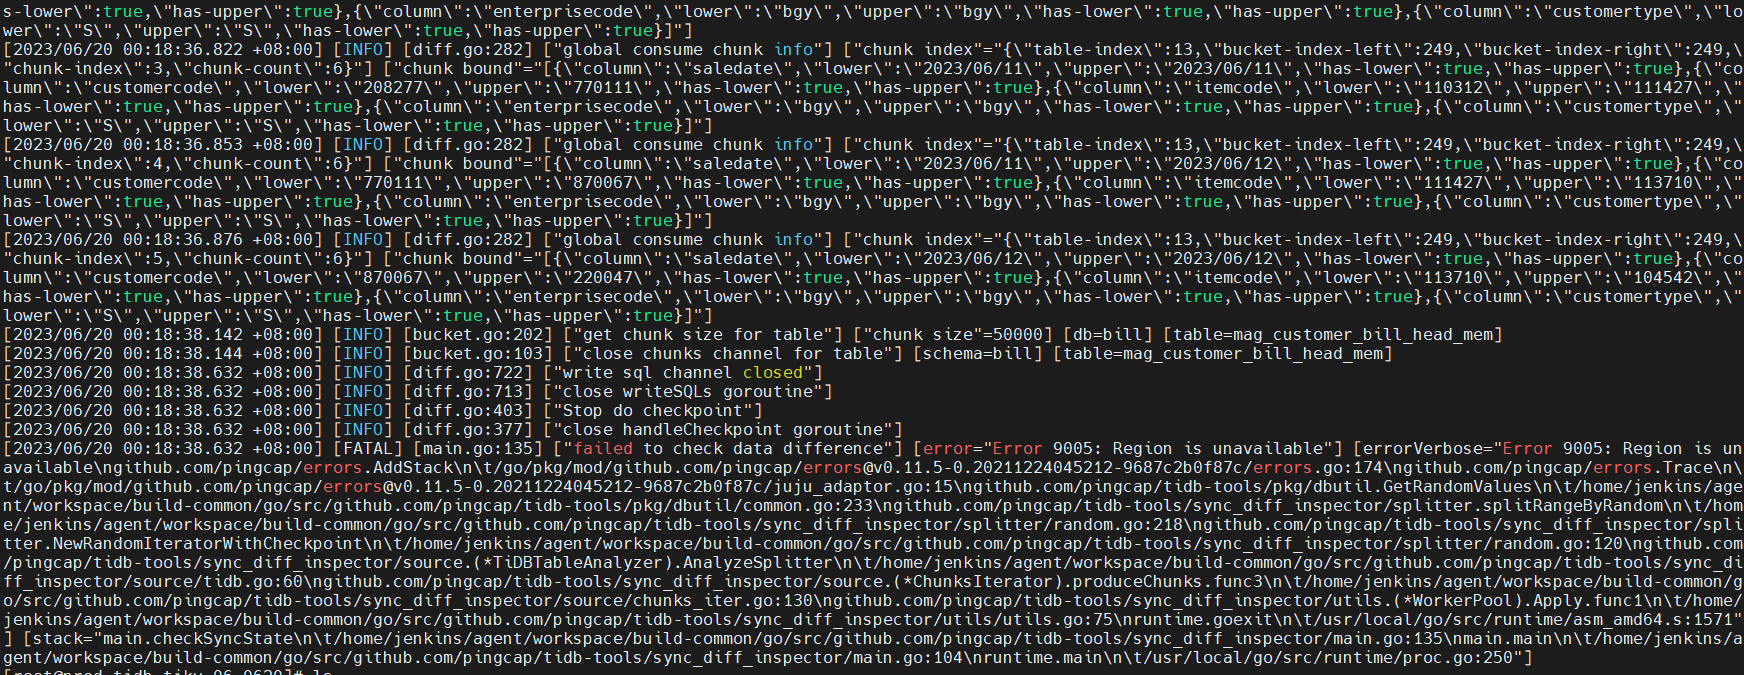
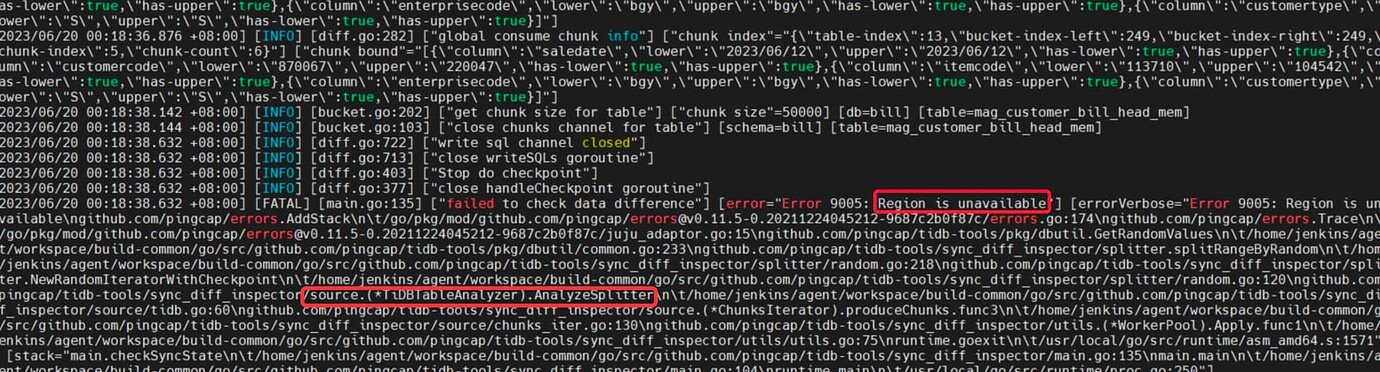
sync_diff_inspector comparing data between the primary database and the disaster recovery environment, prompts “Region is unavailable,” and the comparison program exits
【Resource Configuration】Go to TiDB Dashboard - Cluster Info - Hosts and take a screenshot of this page
【Attachments: Screenshots/Logs/Monitoring】
If the load pressure on TiFlash is too high, it may cause TiFlash data synchronization to lag, and some queries may return a Region Unavailable error.
In this case, you can add more TiFlash nodes to share the load pressure.
There are no TiFlash nodes, only TiKV nodes.
The “region is unavailable” error in TiDB occurs when the backoff time exceeds the threshold (20 seconds) due to various issues. Common causes include:
-
More than half of the TiKV or TiFlash replicas are unavailable or restarted simultaneously, causing raftgroup multi-replica failures. Note that the TiDB cluster allows the number of problematic TiKVs based on the majority of replicas being available, regardless of the number of hosts running TiKV.
-
No leader is accessible within the backoff time:
(1) TiKV is very busy, and the region does not elect a leader within the backoff time;
(2) The region has issues and cannot elect a leader;
(3) Region split takes too long.
-
Region split/merge fails to synchronize the split/merge operation within the backoff time after a leader switch when the follower apply is slow.
-
Other situations: such as incomplete version upgrades, bugs, etc. For example: TiDB 5.3.3 Release Note | PingCAP 文档中心
Which specific monitoring metrics should we look at?
Set the TSO in the configuration file.
I don’t understand, which configuration file should be set with tso?
The snapshot needs to keep the timelines of the two databases consistent.
It feels like there aren’t enough resources.
The time is consistent; if it is not consistent, an error is reported directly, not just when comparing.
From the monitoring, the resources are sufficient, and no related bottlenecks are observed.
From the tidb.log and tikv.log logs, no relevant errors were found. It’s just that this database has a relatively large number of tables, nearly 9000 tables. Every time, whether during busy or idle times, when comparing data, it takes 15 minutes to execute, and then this error occurs.
Can this error indicate whether it is a source or target error?
It should be an issue triggered during processing on the source end.
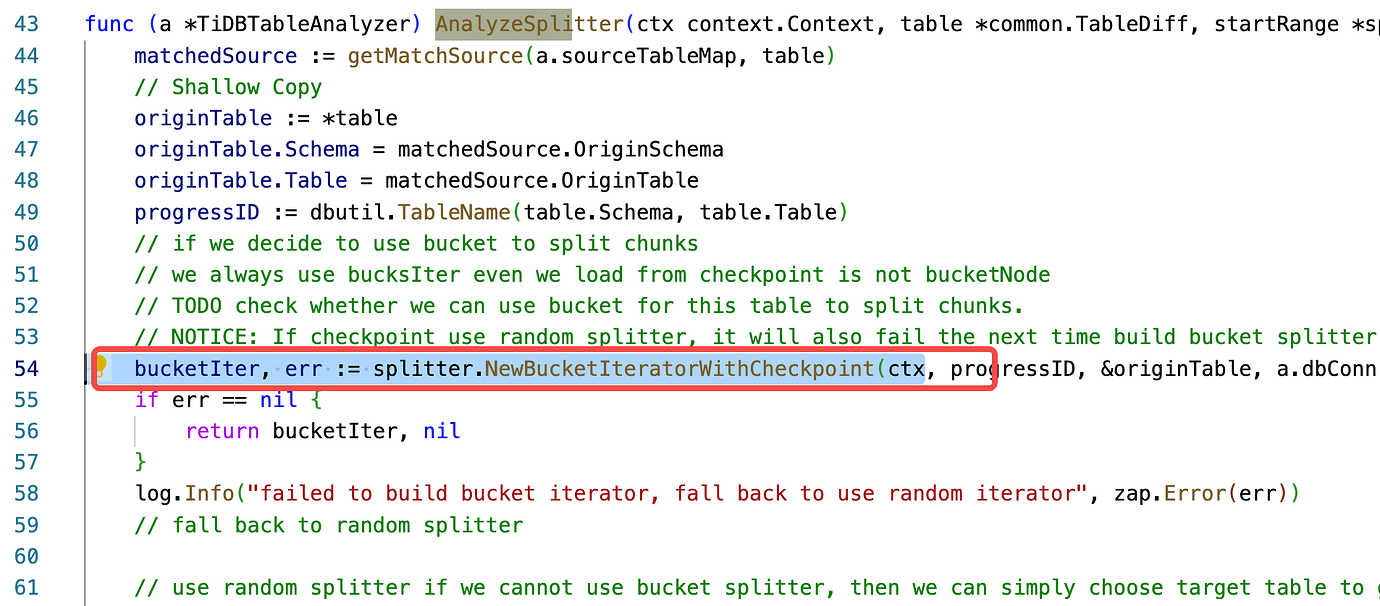
From the stack trace, the problem occurred when stepping down from this line:
AnalyzeSplitter --》
NewRandomIteratorWithCheckpoint
Although I haven’t looked into it in detail, it should be sending some SQL to TiDB; it’s strange that there are no clues.
You can also enable sync_diff debug level log to check.
The above is the content of the sync_diff log. The debug log should not be enabled; if it were, it would be quite large. When the comparison was normal before, 8 threads were used for the comparison, and it took 9 hours to complete.
Now it can be stably reproduced, and this error will definitely occur after running for 15 minutes. It has been running for several days, and it feels quite difficult to eliminate this fault. Also, I don’t dare to run comparison tasks during the day.
Okay, then let’s run it tonight. Actually, running it is just to gather more information points. Directly following approach 2 should also reveal some issues (metrics, full tidb.log at the time point when the upstream changes, and full sync_diff log all need to be checked).