Note:
This topic has been translated from a Chinese forum by GPT and might contain errors.
Original topic: sysbench insert触发流控
[TiDB Usage Environment] v6.1.0
8 cores, 32GB RAM, Disk IOPS 15,000
[Overview] Scenario + Problem Overview
Using sysbench for stress testing, preparing stress test data (Test time: 2022-08-21 19:00~2022-08-22 07:00)
sysbench --config-file=sysbench.cfg oltp_point_select --tables=32 --table-size=10000000 prepare
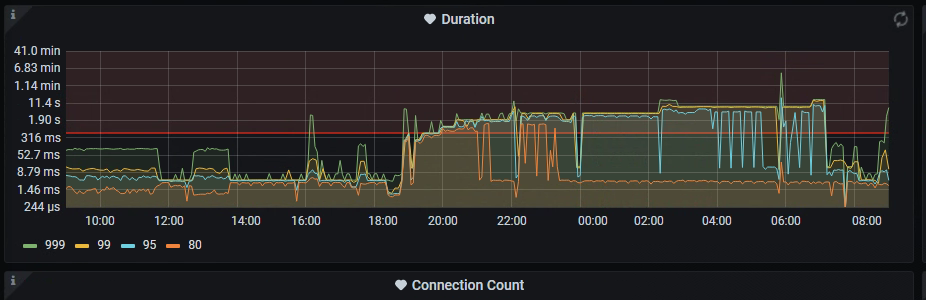
In 12 hours, less than 200 million data was written, and the writing speed became slower and slower. There are no locks observed in tikv.log.
[Phenomenon] Business and Database Phenomenon
[Problem] Current Issues Encountered
Slow write speed
[TiDB Version]
v6.1.0
[Attachments] Relevant Logs and Configuration Information
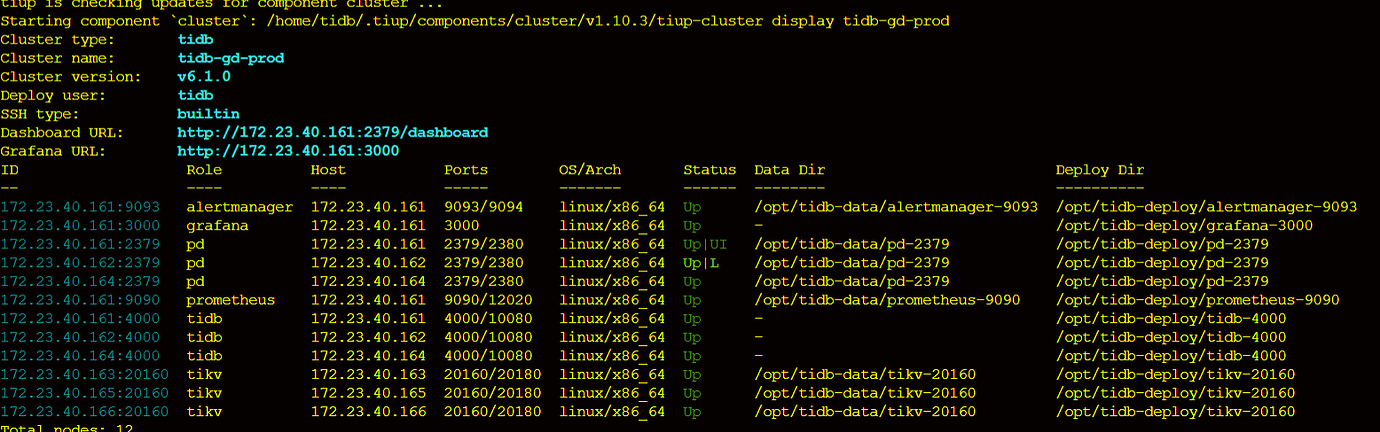
- TiUP Cluster Display Information
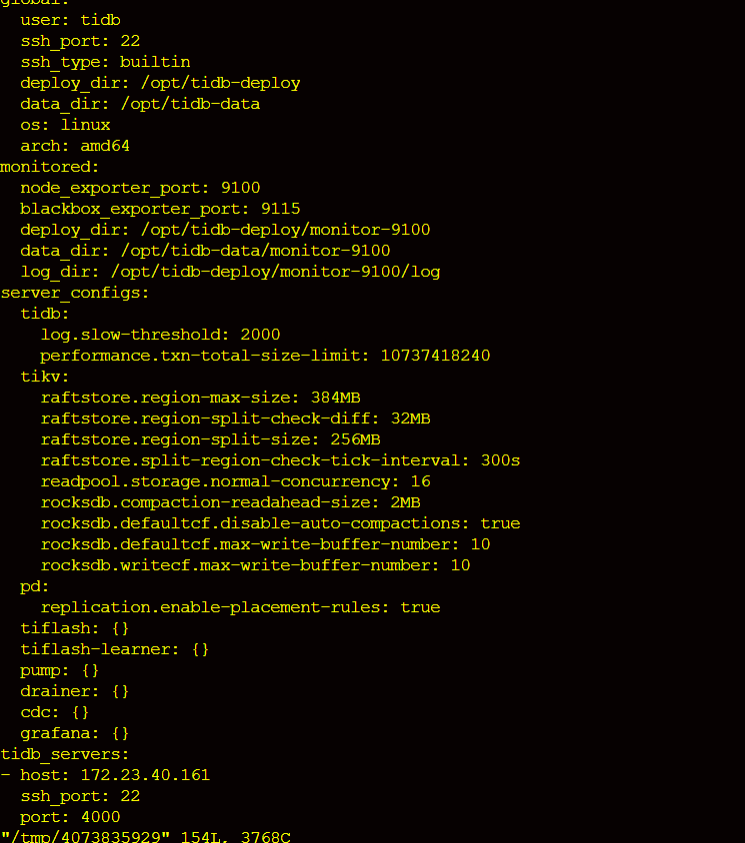
- TiUP Cluster Edit Config Information
Append data to the memory memtable.
The write_buffer_size controls the size of the data stored in the memtable. Once this threshold is exceeded, the memtable will transfer the data.
After the memtable is full, it will transfer the data to the immutable memtable. When there is one immutable memtable, it will start flushing data to the disk.
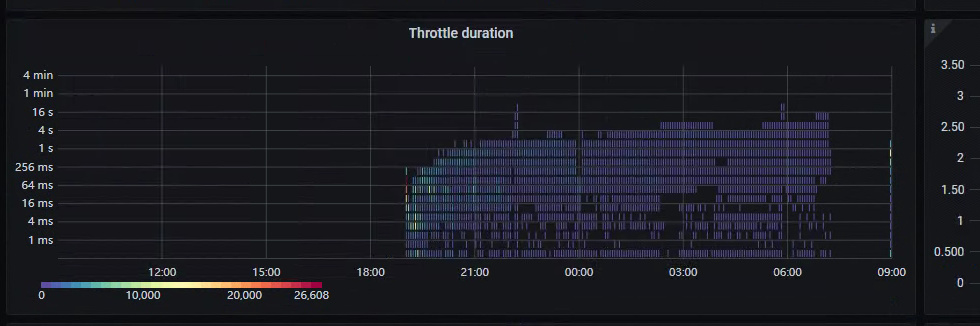
When data is written too quickly, if there are more than 5 immutable memtables, the LSM will perform flow control (write stall) on the memtable.
TiKV itself has a flow control mechanism.
Are there any optimization methods?
The image is not visible. Please provide the text you need translated.
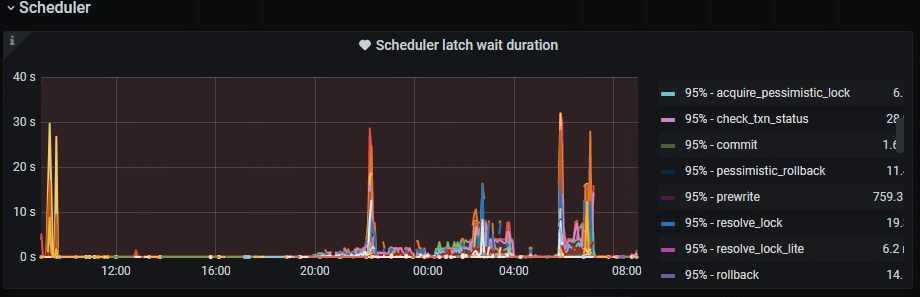
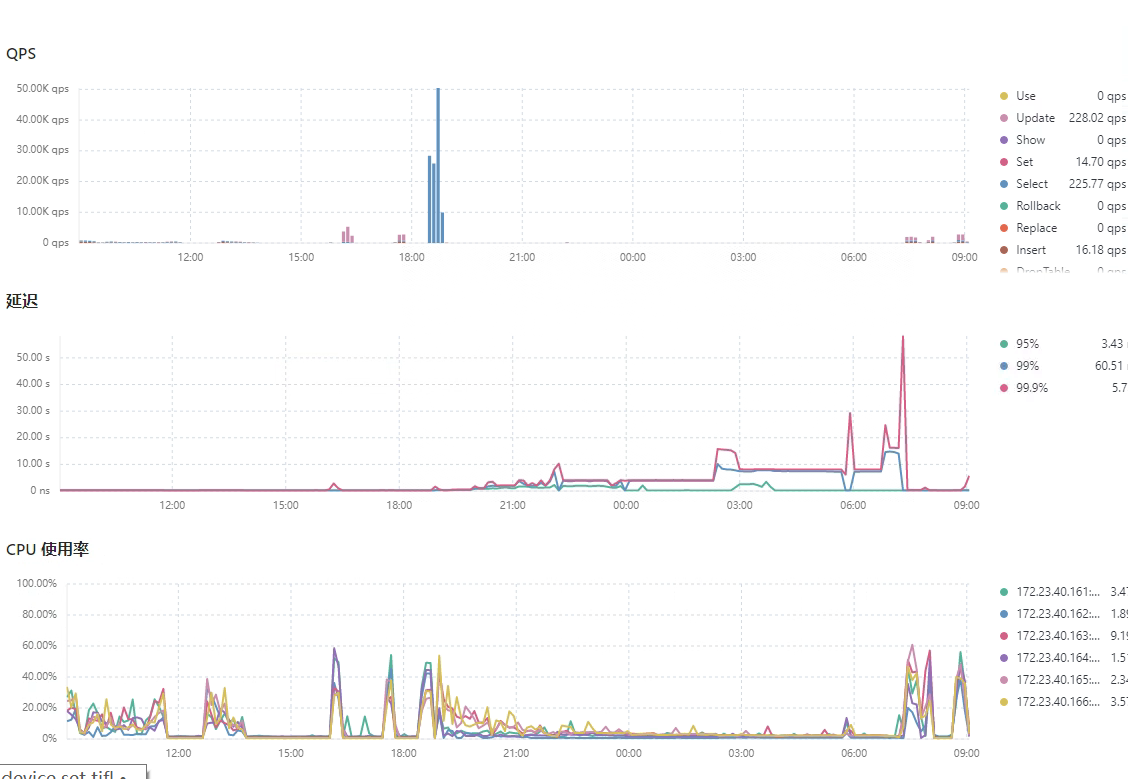
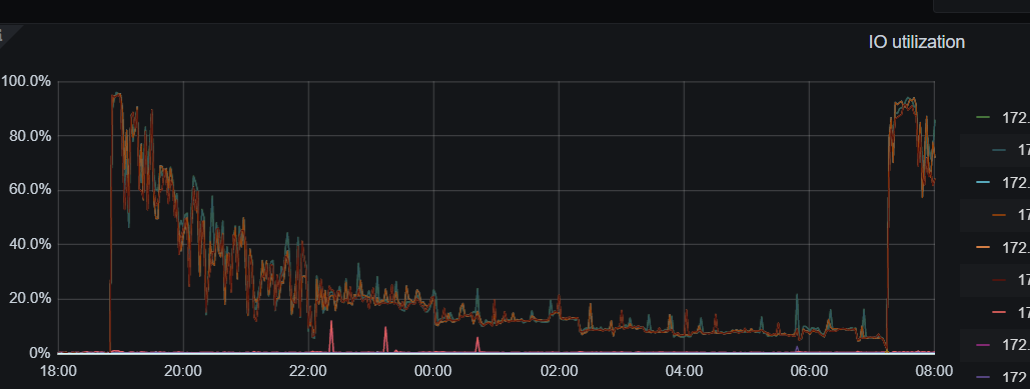
When idle, the scheduler work CPU usage is not high between 20:00 and 7:00.
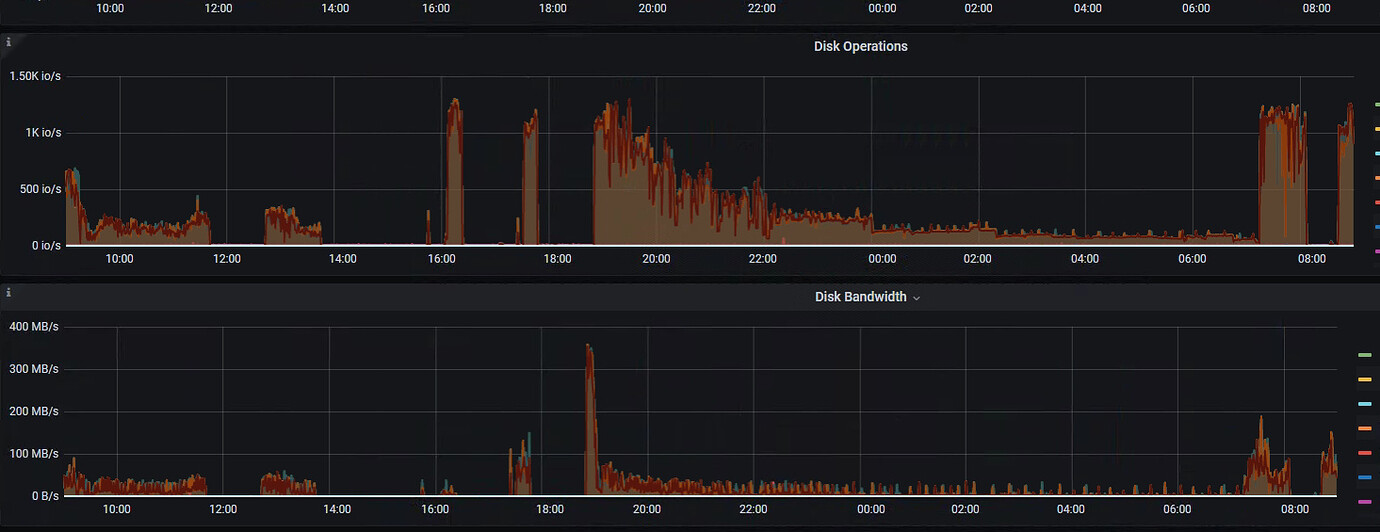
It looks like the IO has reached its bottleneck.
The IO doesn’t seem to have a bottleneck, there is flow control, and write stall is normal. What exactly triggered the flow control? Is TiDB really this fragile?
https://metricstool.pingcap.com/#backup-with-dev-tools Click here to export the monitoring data for overview, pd, tidb, and tikv. Make sure to expand all panels and wait for the data to load completely before exporting.
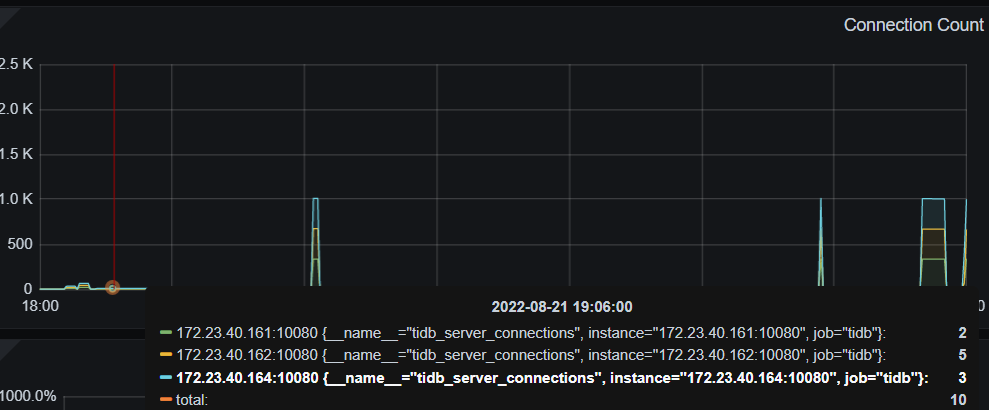
These few images show that there is no disk bottleneck.
Boss, please help analyze this!
Try increasing these two settings:
set config tikv rocksdb.max-background-jobs=
set config tikv rocksdb.max-sub-compactions=
The preparation process involves creating tables, loading data, and adding indexes. The sysbench is completed, and it should be with 8 threads. The prepare execution started around 7 PM on the 21st and was checked at 7 AM the next day. Data was written up to the 18th table (each table with 1KW data). Tables sbtest1-8 were written in one batch, and sbtest9-16 in another batch. The first two batches were already completed, so the estimated data write volume is between 160 million to 200 million.
The main issue is not understanding why flow control is triggered.
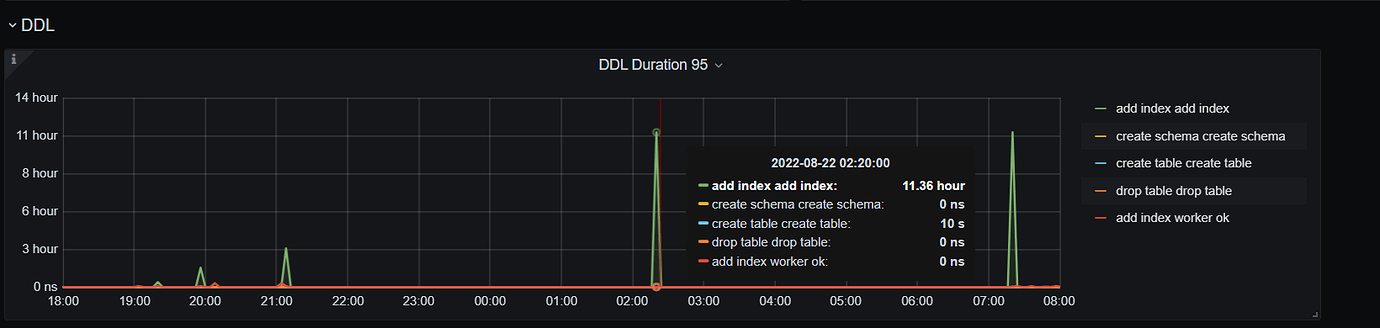
After the execution is completed, check admin show ddl jobs. From the monitoring, there is no write stall.
Does the table have an index?
During the process of creating tables, building indexes, and writing data, it is generally recommended to insert the data first and then create the indexes.