System-wide Intermittent Freezing After Running TiDB 6.5.0 for 7 Days

Note:
This topic has been translated from a Chinese forum by GPT and might contain errors.

Original topic: TIDB6.5.0运行7天后系统不定时的全面卡顿

| username: TiDBer_G64jJ9u8

[TiDB Usage Environment] Production Environment / Testing / Poc
[TiDB Version] 6.5.0 Kirin V10 SP1
[Reproduction Path] The issue occurred after normal system operations (deletion, modification) running for 7 days.
[Encountered Issue: Phenomenon and Impact] The system experiences intermittent stuttering, and all SQL queries are slow.
[Resource Configuration]
[Attachments: Screenshots/Logs/Monitoring]

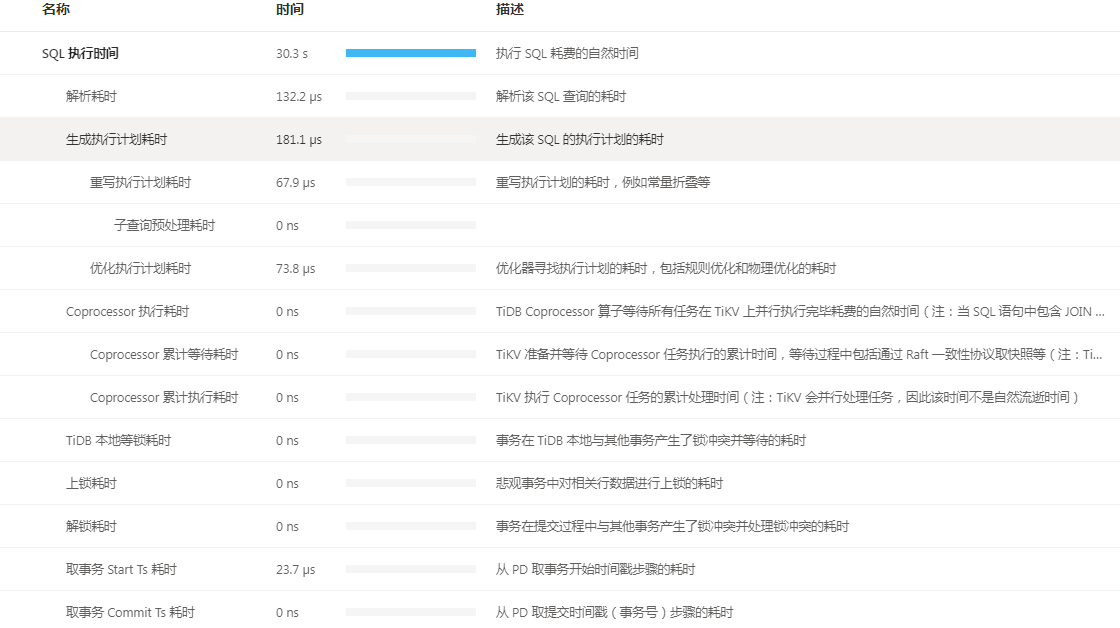
Even simple point queries are very slow, but the query process does not show the elapsed time.

| username: 像风一样的男子 | Original post link

When there is a lag, how much is the database latency? You can check the topsql monitoring situation during the lag.

| username: zhanggame1 | Original post link

First, check the logs of each component for any anomalies. Then, check if the I/O is normal, if the network is normal, and if there is any packet loss.

| username: TiDBer_G64jJ9u8 | Original post link

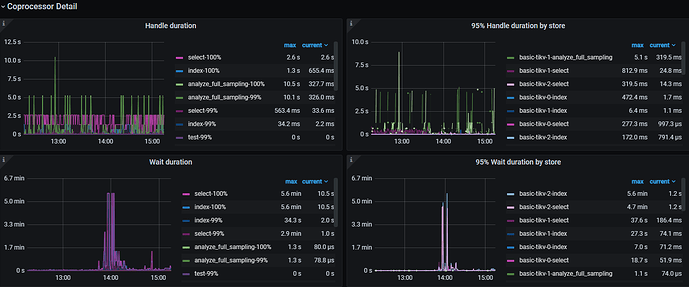
Take a look at this Conprocessor waiting for minutes.

| username: kkpeter | Original post link

Cannot see the CPU and disk I/O status of each node.

| username: TiDBer_G64jJ9u8 | Original post link

%Cpu(s): 14.7 us, 3.0 sy, 0.0 ni, 79.5 id, 0.4 wa, 0.8 hi, 1.6 si, 0.0 st
MiB Mem : 62456.0 total, 6171.3 free, 41895.9 used, 14388.8 buff/cache
MiB Swap: 0.0 total, 0.0 free, 0.0 used. 12970.5 avail Mem

%Cpu(s): 9.9 us, 2.3 sy, 0.0 ni, 84.2 id, 0.7 wa, 1.0 hi, 1.9 si, 0.0 st
MiB Mem : 62010.6 total, 4229.6 free, 47955.8 used, 9825.2 buff/cache
MiB Swap: 0.0 total, 0.0 free, 0.0 used. 5475.9 avail Mem

%Cpu(s): 10.8 us, 2.0 sy, 0.0 ni, 84.0 id, 0.9 wa, 0.7 hi, 1.6 si, 0.0 st
MiB Mem : 62456.1 total, 6707.9 free, 39906.3 used, 15841.9 buff/cache
MiB Swap: 0.0 total, 0.0 free, 0.0 used. 14728.4 avail Mem

avg-cpu: %user %nice %system %iowait %steal %idle
7.78 0.00 3.65 1.32 0.00 87.26

Device tps kB_read/s kB_wrtn/s kB_dscd/s kB_read kB_wrtn kB_dscd
dm-0 169.43 652.69 16338.08 0.00 230389452 5767077836 0
dm-1 0.00 0.01 0.00 0.00 3264 0 0
dm-2 0.00 0.00 0.00 0.00 1536 0 0
loop0 0.02 9.47 0.00 0.00 3342534 0 0
sda 164.46 668.51 16338.15 0.00 235972763 5767103709 0

avg-cpu: %user %nice %system %iowait %steal %idle
11.96 0.00 6.64 0.80 0.00 80.60

Device tps kB_read/s kB_wrtn/s kB_dscd/s kB_read kB_wrtn kB_dscd
dm-0 125.17 333.36 13597.69 0.00 124008484 5058228792 0
dm-1 0.00 0.01 0.00 0.00 3072 0 0
dm-2 0.00 0.00 0.00 0.00 1344 0 0
sda 122.02 333.51 13597.76 0.00 124063621 5058254556 0

avg-cpu: %user %nice %system %iowait %steal %idle
12.06 0.00 4.70 0.77 0.00 82.47

Device tps kB_read/s kB_wrtn/s kB_dscd/s kB_read kB_wrtn kB_dscd
dm-0 126.31 291.85 13396.25 0.00 108540900 4982185168 0
dm-1 0.00 0.01 0.00 0.00 3072 0 0
dm-2 0.00 0.00 0.00 0.00 1344 0 0
sda 123.82 292.00 13396.32 0.00 108595757 4982210920 0

| username: 像风一样的男子 | Original post link

Check the TopSQL on the dashboard. Was there high concurrency with slow SQL at that time?

| username: cassblanca | Original post link

The average CPU idle time is over 80%, and the instantaneous disk write is only around 16M. The resources are not busy. If this is a TiKV deployment disk, there should be no write bottleneck. The Coprocessor wait is relatively high, so it is necessary to check if there is a network communication issue.

| username: TiDBer_G64jJ9u8 | Original post link

Based on the information, it seems there is an issue with obtaining the snapshot. However, after checking the TiKV logs, there are numerous error logs related to obtaining the snapshot:

[2023/09/04 11:42:43.293 +00:00] [INFO] [scheduler.rs:742] [“get snapshot failed”] [err=“Error(Request(message: "EpochNotMatch current epoch of region 65525 is conf_ver: 5 version: 1343, but you sent conf_ver: 5 version: 1342" epoch_not_match { current_regions { id: 65525 start_key: 748000000000000BFFE65F698000000000FF0000020161633162FF36653261FF2D3034FF38362D3436FF3364FF2D623262372DFF63FF61633862663739FFFF313538645F616235FFFF37396263352D39FF64FF34622D343666FF342DFF383433312DFF393234FF34653266FF30336136FF665F31FF3530333037FF3331FF393631343636FF38FF382F3135303330FFFF3733323038353832FFFF3134342F313530FF33FF303733323138FF3030FF323934342FFF5F3135FF30333037FF31363237FF383337FF3935322F31FF3530FF333037313637FF34FF3539373337362FFFFF3135303330373137FFFF35323936333037FF32FF2F3135303330FF3731FF3836343536FF393835FF362F0000FF00000000F9038000FF0000000309A50000FD end_key: 748000000000000BFFE65F728000000000FF0051D80000000000FA region_epoch { conf_ver: 5 version: 1343 } peers { id: 65526 store_id: 1 } peers { id: 65527 store_id: 4 } peers { id: 65528 store_id: 5 } } current_regions { id: 65541 start_key: 748000000000000BFFE600000000000000F8 end_key: 748000000000000BFFE65F698000000000FF0000020161633162FF36653261FF2D3034FF38362D3436FF3364FF2D623262372DFF63FF61633862663739FFFF313538645F616235FFFF37396263352D39FF64FF34622D343666FF342DFF383433312DFF393234FF34653266FF30336136FF665F31FF3530333037FF3331FF393631343636FF38FF382F3135303330FFFF3733323038353832FFFF3134342F313530FF33FF303733323138FF3030FF323934342FFF5F3135FF30333037FF31363237FF383337FF3935322F31FF3530FF333037313637FF34FF3539373337362FFFFF3135303330373137FFFF35323936333037FF32FF2F3135303330FF3731FF3836343536FF393835FF362F0000FF00000000F9038000FF0000000309A50000FD region_epoch { conf_ver: 5 version: 1343 } peers { id: 65542 store_id: 1 } peers { id: 65543 store_id: 4 } peers { id: 65544 store_id: 5 } } }))”] [cid=18684620]

[2023/09/04 11:55:59.277 +00:00] [INFO] [scheduler.rs:742] [“get snapshot failed”] [err=“Error(Request(message: "peer is not leader for region 65525, leader may Some(id: 65527 store_id: 4)" not_leader { region_id: 65525 leader { id: 65527 store_id: 4 } }))”] [cid=22719018]

| username: Jellybean | Original post link

This error usually occurs when there is a split or scheduling migration while accessing a region, causing the target region to no longer be the leader, which means that the old region metadata cannot be used to access the data. TiDB has a backoff mechanism, so this is relatively rare.

You can check if the cluster is frequently performing operations like region leader scheduling, region splitting, or region merging. These operations can change the metadata, leading to similar error logs during access.

| username: RenlySir | Original post link

Is there an error in the execution plan?

| username: redgame | Original post link

Metadata error or inconsistency? Try repairing the metadata.

| username: 像风一样的男子 | Original post link

Do you see the “Region is unavailable” error in the logs?

| username: Fly-bird | Original post link

It’s better to monitor resource utilization more closely.

| username: TiDBer_G64jJ9u8 | Original post link

Why is the leader of the region being re-elected for no reason?

| username: TiDBer_G64jJ9u8 | Original post link

There are no logs reporting “Region is unavailable.”

| username: TiDBer_G64jJ9u8 | Original post link

Is there any expert who can determine why the leader keeps migrating:

[2023/09/05 05:56:33.172 +00:00] [INFO] [region.go:652] [“leader changed”] [region-id=14949] [from=1] [to=5]
[2023/09/05 05:56:33.173 +00:00] [INFO] [operator_controller.go:565] [“operator finish”] [region-id=14949] [takes=19.191438ms] [operator=“"transfer-hot-write-leader {transfer leader: store 1 to 5} (kind:hot-region,leader, region:14949(689, 5), createAt:2023-09-05 05:56:33.152466395 +0000 UTC m=+442838.523916073, startAt:2023-09-05 05:56:33.154171016 +0000 UTC m=+442838.525620714, currentStep:1, size:67, steps:[transfer leader from store 1 to store 5], timeout:[1m0s]) finished"”] [additional-info=]
[2023/09/05 05:57:44.090 +00:00] [INFO] [operator_controller.go:452] [“add operator”] [region-id=14949] [operator=“"transfer-hot-write-leader {transfer leader: store 5 to 1} (kind:hot-region,leader, region:14949(689, 5), createAt:2023-09-05 05:57:44.08887786 +0000 UTC m=+442909.460327558, startAt:0001-01-01 00:00:00 +0000 UTC, currentStep:0, size:69, steps:[transfer leader from store 5 to store 1], timeout:[1m0s])"”] [additional-info=]
[2023/09/05 05:57:44.091 +00:00] [INFO] [operator_controller.go:651] [“send schedule command”] [region-id=14949] [step=“transfer leader from store 5 to store 1”] [source=create]
[2023/09/05 05:57:44.111 +00:00] [INFO] [region.go:652] [“leader changed”] [region-id=14949] [from=5] [to=1]
[2023/09/05 05:57:44.112 +00:00] [INFO] [operator_controller.go:565] [“operator finish”] [region-id=14949] [takes=20.841019ms] [operator=“"transfer-hot-write-leader {transfer leader: store 5 to 1} (kind:hot-region,leader, region:14949(689, 5), createAt:2023-09-05 05:57:44.08887786 +0000 UTC m=+442909.460327558, startAt:2023-09-05 05:57:44.091564863 +0000 UTC m=+442909.463014581, currentStep:1, size:69, steps:[transfer leader from store 5 to store 1], timeout:[1m0s]) finished"”] [additional-info=]
[2023/09/05 06:02:30.686 +00:00] [INFO] [operator_controller.go:452] [“add operator”] [region-id=14949] [operator=“"transfer-hot-write-leader {transfer leader: store 1 to 4} (kind:hot-region,leader, region:14949(689, 5), createAt:2023-09-05 06:02:30.685909429 +0000 UTC m=+443196.057359127, startAt:0001-01-01 00:00:00 +0000 UTC, currentStep:0, size:67, steps:[transfer leader from store 1 to store 4], timeout:[1m0s])"”] [additional-info=]
[2023/09/05 06:02:30.687 +00:00] [INFO] [operator_controller.go:651] [“send schedule command”] [region-id=14949] [step=“transfer leader from store 1 to store 4”] [source=create]
[2023/09/05 06:02:30.753 +00:00] [INFO] [region.go:652] [“leader changed”] [region-id=14949] [from=1] [to=4]
[2023/09/05 06:02:30.754 +00:00] [INFO] [operator_controller.go:565] [“operator finish”] [region-id=14949] [takes=67.698522ms] [operator=“"transfer-hot-write-leader {transfer leader: store 1 to 4} (kind:hot-region,leader, region:14949(689, 5), createAt:2023-09-05 06:02:30.685909429 +0000 UTC m=+443196.057359127, startAt:2023-09-05 06:02:30.68728017 +0000 UTC m=+443196.058729868, currentStep:1, size:67, steps:[transfer leader from store 1 to store 4], timeout:[1m0s]) finished"”] [additional-info=]
[2023/09/05 06:11:50.704 +00:00] [INFO] [operator_controller.go:452] [“add operator”] [region-id=14949] [operator=“"transfer-hot-write-leader {transfer leader: store 4 to 5} (kind:hot-region,leader, region:14949(689, 5), createAt:2023-09-05 06:11:50.702114441 +0000 UTC m=+443756.073564119, startAt:0001-01-01 00:00:00 +0000 UTC, currentStep:0, size:65, steps:[transfer leader from store 4 to store 5], timeout:[1m0s])"”] [additional-info=]
[2023/09/05 06:11:50.705 +00:00] [INFO] [operator_controller.go:651] [“send schedule command”] [region-id=14949] [step=“transfer leader from store 4 to store 5”] [source=create]
[2023/09/05 06:11:50.727 +00:00] [INFO] [region.go:652] [“leader changed”] [region-id=14949] [from=4] [to=5]
[2023/09/05 06:11:50.727 +00:00] [INFO] [operator_controller.go:565] [“operator finish”] [region-id=14949] [takes=22.1607ms] [operator=“"transfer-hot-write-leader {transfer leader: store 4 to 5} (kind:hot-region,leader, region:14949(689, 5), createAt:2023-09-05 06:11:50.702114441 +0000 UTC m=+443756.073564119, startAt:2023-09-05 06:11:50.705766004 +0000 UTC m=+443756.077215702, currentStep:1, size:65, steps:[transfer leader from store 4 to store 5], timeout:[1m0s]) finished"”] [additional-info=]
| username: Jellybean | Original post link

Confirm whether this TiKV instance is normal.

Also, check the scheduling policy of PD to confirm if there is an eviction leader policy for this store_id.