The actual execution of "select for update" did not hit the index, and using FORCE INDEX also did not use the index

Note:
This topic has been translated from a Chinese forum by GPT and might contain errors.

Original topic: select for update实际执行未命中索引,使用了FORCE INDEX 也没有走到索引上

| username: TIDB要

[TiDB Usage Environment] Production Environment
[TiDB Version] 5.0.5
[Reproduction Path] select for update
[Encountered Problem: Problem Phenomenon and Impact] The execution plan is displayed on the dashboard, and force index is used, but the index is still not used, resulting in table locking for about 10 seconds. This problem occurs frequently.
[Resource Configuration] High-performance server
[Attachment: Screenshot/Log/Monitoring]
The actual execution result shows that the index was not used.

Table structure:

CREATE TABLE `lp` (
  `id` bigint(20) NOT NULL AUTO_INCREMENT,
  `account_id` bigint(20) NOT NULL,
  `seg_t` varchar(10) NOT NULL DEFAULT 'CCC',
  `type` varchar(1) NOT NULL,
  `stock` bigint(20) NOT NULL,
  `m` varchar(10) NOT NULL DEFAULT 'UUU',
  `sec_t` varchar(10) NOT NULL DEFAULT 'TKTK',
  `q` double NOT NULL,
  `d_q` decimal(30, 10) NOT NULL DEFAULT '0.0000000000',
  `a_c` decimal(30, 10) DEFAULT NULL,
  `l_o_a` datetime DEFAULT NULL,
  `business_from` date NOT NULL,
  `business_to` date NOT NULL,
  `created_at` datetime NOT NULL DEFAULT CURRENT_TIMESTAMP,
  `updated_at` datetime NOT NULL DEFAULT CURRENT_TIMESTAMP ON UPDATE CURRENT_TIMESTAMP,
  PRIMARY KEY (`id`),
  UNIQUE KEY `lp_unique_key` (
    `account_id`,
    `stock`,
    `business_to`,
    `type`
  ),
  KEY `idx_lp_from_date` (`business_from`),
  KEY `IDX_LEDGER_POSITION_STOCK_ID_DATE` (`stock`, `business_to`),
  KEY `idx_lp_account_date` (`account_id`, `business_to`)
) ENGINE = InnoDB AUTO_INCREMENT = xxxxxxxx DEFAULT CHARSET = utf8 ROW_FORMAT = DYNAMIC

The executed SQL statement is:

SELECT xxxxx
FROM
  lp FORCE INDEX(lp_unique_key)
WHERE
  (
    account_id = ?
    AND stock = ?
    AND `type` = ?
    AND business_to >= ?
  ) FOR
UPDATE
  [arguments: (90019329700, 30443, T, 2023-01-18 00:00:00)];

The execution plan is:

	id                      	task     	estRows	operator info                                                                                                                                                                                                                        	actRows	execution info                                                                                                                                                                                                                                                                                                                                                                                                                                                                                                 	memory 	disk
	SelectLock_7            	root     	0.09   	for update 0                                                                                                                                                                                                                         	2      	time:8.38s, loops:4, lock_keys: {time:663.5µs, region:1, keys:1, lock_rpc:636.761µs, rpc_count:1}                                                                                                                                                                                                                                                                                                                                                                                                            	N/A    	N/A
	└─UnionScan_8           	root     	0.09   	eq(lp.lp.account_id, 9193297), eq(lp.lp.stock_id, 30443), eq(lp.lp.type, "T"), ge(lp.lp.business_to, 2023-01-18 00:00:00.000000)	2      	time:11.3ms, loops:4                                                                                                                                                                                                                                                                                                                                                                                                                                                                                           	N/A    	N/A
	  └─IndexLookUp_12      	root     	0.09   	                                                                                                                                                                                                                                     	2      	time:11.3ms, loops:6, index_task: {total_time: 1.25ms, fetch_handle: 1.24ms, build: 1.44µs, wait: 4.9µs}, table_task: {total_time: 16.6ms, num: 2, concurrency: 10}                                                                                                                                                                                                                                                                                                                                          	16.5 KB	N/A
	    ├─Selection_11      	cop[tikv]	0.09   	eq(lp.lp.type, "T")                                                                                                                                                                                          	2      	time:1.21ms, loops:6, cop_task: {num: 2, max: 852.4µs, min: 309.3µs, avg: 580.8µs, p95: 852.4µs, max_proc_keys: 2, p95_proc_keys: 2, rpc_num: 2, rpc_time: 1.12ms, copr_cache_hit_ratio: 0.00}, tikv_task:{proc max:0s, min:0s, p80:0s, p95:0s, iters:2, tasks:2}, scan_detail: {total_process_keys: 4, total_keys: 22, rocksdb: {delete_skipped_count: 8, key_skipped_count: 36, block: {cache_hit_count: 24, read_count: 0, read_byte: 0 Bytes}}}                                                        	N/A    	N/A
	    │ └─IndexRangeScan_9	cop[tikv]	0.18   	table:lp, index:lp_unique_key(account_id, stock, business_to, type), range:[9193297 30443 2023-01-18,9193297 30443 +inf], keep order:false                                                                     	4      	tikv_task:{proc max:0s, min:0s, p80:0s, p95:0s, iters:2, tasks:2}, scan_detail: {total_process_keys: 0, total_keys: 0, rocksdb: {delete_skipped_count: 0, key_skipped_count: 0, block: {cache_hit_count: 0, read_count: 0, read_byte: 0 Bytes}}}                                                                                                                                                                                                                                                               	N/A    	N/A
	    └─TableRowIDScan_10 	cop[tikv]	0.09   	lp, keep order:false                                                                                                                                                                                             	2      	time:9.57ms, loops:4, cop_task: {num: 2, max: 572µs, min: 321.1µs, avg: 446.6µs, p95: 572µs, max_proc_keys: 1, p95_proc_keys: 1, tot_proc: 1ms, rpc_num: 3, rpc_time: 1.36ms, copr_cache_hit_ratio: 0.00}, ResolveLock:{num_rpc:1, total_time:7.99ms}, tikv_task:{proc max:1ms, min:0s, p80:1ms, p95:1ms, iters:2, tasks:2}, scan_detail: {total_process_keys: 2, total_keys: 2, rocksdb: {delete_skipped_count: 0, key_skipped_count: 0, block: {cache_hit_count: 16, read_count: 0, read_byte: 0 Bytes}}}	N/A    	N/A

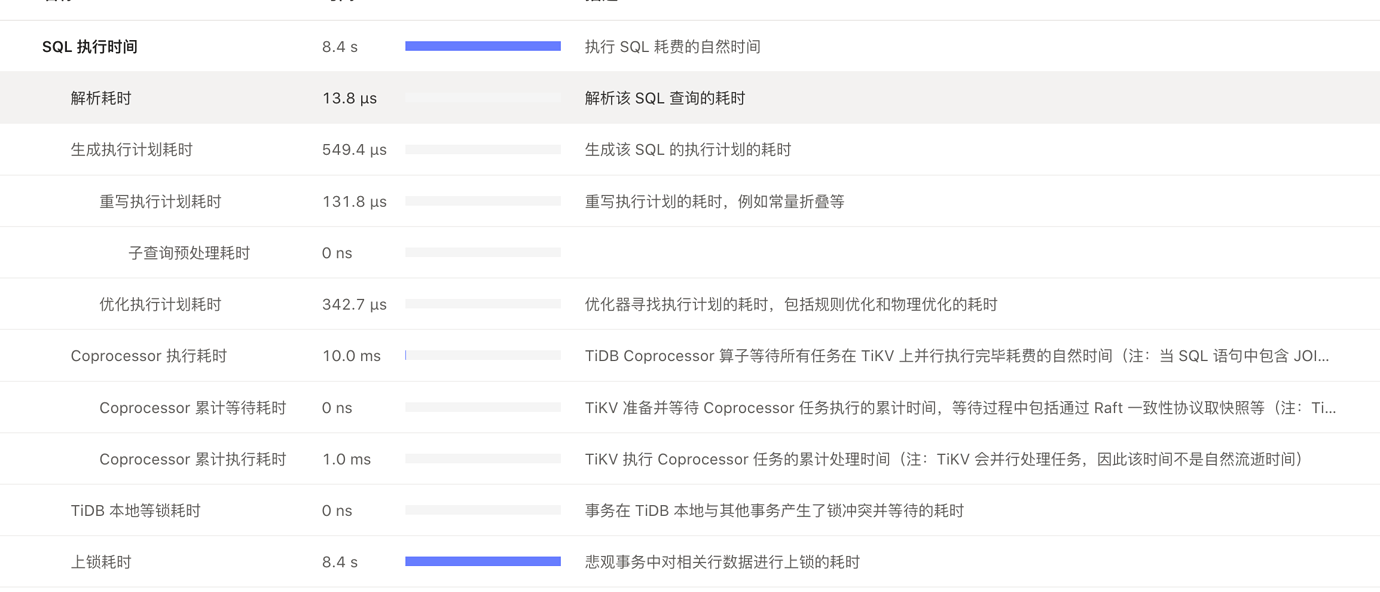
Stage time consumption:
![image|690x296](https://asktug.com/uploads/default/optimized/4X/0/8/9/089e7968a6280ad7b76d341bcffef8e368095caa_2_1380x592.png)
![image|690x284](https://asktug.com/uploads/default/optimized/4X/b/c/c/bccc5eae0bfc45f5d81a097005cf0fed2a5f62f1_2_1380x568.png)

The isolation level is RR, Repeatable Read.
| username: Kongdom | Original post link

IndexRangeScan_9 means using an index, right?

| username: 裤衩儿飞上天 | Original post link

  1. As mentioned above, the execution plan shows that an index is already being used.
  2. If it’s a simple query, why use “for update”? “For update” will add a write lock, and if another session is modifying this record, it will cause a lock wait. For a simple query, it is recommended to remove “for update”.
| username: TIDB要 | Original post link

  1. The execution plan shows that an index is used, but the actual execution does not use the index, as shown in Figure 1.
  2. In the business logic, a write lock is needed to ensure the atomicity of writing data, and the entire operation is performed within a transaction, so forUpdate needs to be added. A write lock is needed before writing this data (the locking method is also using the SQL described in the problem to lock), so is it caused by table locking?
| username: TIDB要 | Original post link

The execution plan shows that an index is used, but in actual execution, the index is not used, as shown in Figure 1.

| username: Kongdom | Original post link

The execution plan is the actual execution. Adding “explain analyze” before the statement gives you the actual execution plan, not the estimated execution plan.

| username: 裤衩儿飞上天 | Original post link

  1. Your execution plan is manually executed and displayed, right? Is it at the same point in time as the SQL in your screenshot?
  2. Personally, I still think it’s best to avoid using the “for update” method. If not used properly, it often leads to accidental table locks. You can consider the following approach:
    begin
    XXXXX;
    XXXXXX;
    commit;
| username: Kongdom | Original post link

This can’t meet the need for read locks, right?

| username: 裤衩儿飞上天 | Original post link

Yes, it is important to consider the business scenario to see if it is really necessary.

| username: TIDB要 | Original post link

In the business scenario, forUpdate is needed to ensure atomicity. This was used before when using MySQL, and there were no such issues.

| username: TIDB要 | Original post link

If an index is actually used during execution, why does the monitoring show that the index was not used? Or if the index was used, it shouldn’t lock the table, but rather lock specific rows, right?

| username: Kongdom | Original post link

The main focus should be on the execution plan on the slow query page. The fact that the phase value below is not being counted might be a bug.

| username: tidb菜鸟一只 | Original post link

If the execution plan shows that the index is used, then it is used. Judging by the time your SQL takes, it should be the locking time, not the SQL execution time.

| username: 胡杨树旁 | Original post link

Moreover, it shows a lock conflict here. Has the queried data been changed? I wonder if it’s caused by the “for update” clause. Should we try removing the “for update” clause once to see if there’s any change? I’m not sure what caused this lock conflict.

| username: db_user | Original post link

How about trying EXPLAIN ANALYZE? Share the execution plan and see if it matches the one in the dashboard.

| username: TIDB要 | Original post link

It was caused by lock conflicts, suspected to be a table lock. Using select for update is to read the latest data, and the isolation level used is RR.

| username: TIDB要 | Original post link

The execution plan is consistent with the one above.

| username: TIDB要 | Original post link

I suspect it is caused by table locking, so the issue is that the index is not being used. If the index is used, the table would not be locked.

| username: 胡杨树旁 | Original post link

Looking at the information, it seems that there is only table locking and no unlocking, so does this mean that this SQL and other SQLs have a lock conflict? Who is locking whom?