Note:
This topic has been translated from a Chinese forum by GPT and might contain errors.Original topic: 集群卡住两次,出现两批次慢查询
[TiDB Usage Environment] Production Environment
[TiDB Version] v5.4.3
[Encountered Problem]
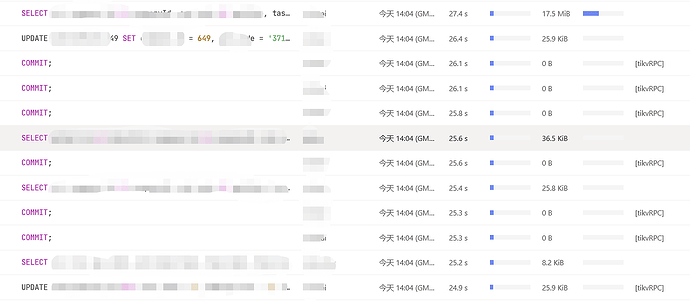
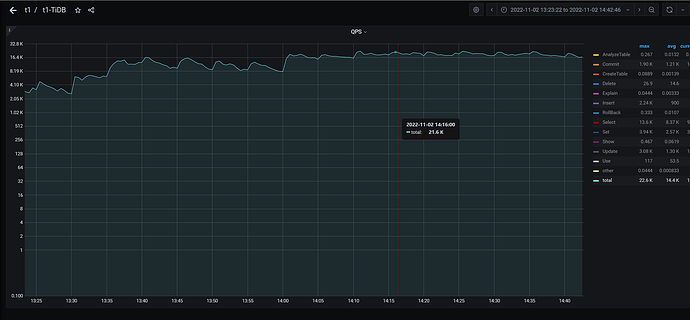
Two batches of slow queries occurred today at 14:04:50 and 14:13, especially the one at 14:04. However, the actual business volume was not high, with QPS less than 30,000. The relevant monitoring is as follows:
Dashboard Slow Query
QPS Monitoring
CPU, memory, IO, and other monitoring are relatively normal, but the following monitoring indicators are abnormal. The official documentation does not provide the meaning of these monitoring indicators, so I do not understand them well.
tikv-details - scheduler-key_mvcc interface
scheduler-txn_heart_neat
[Reproduction Path] Operations performed that led to the problem
Normal business operations
[Problem Phenomenon and Impact]
Many slow queries occurred, and the cluster got stuck twice. It is suspected to be a network issue, but I want to know how to confirm it is a network issue from the monitoring.
[Attachments]
Please provide the version information of each component, such as cdc/tikv, which can be obtained by executing cdc version/tikv-server --version.
