Note:
This topic has been translated from a Chinese forum by GPT and might contain errors.
Original topic: dashboard报该主机上没有实例存活,因此无法获取主机信息
[TiDB Usage Environment] Testing
[TiDB Version] 6.1.0
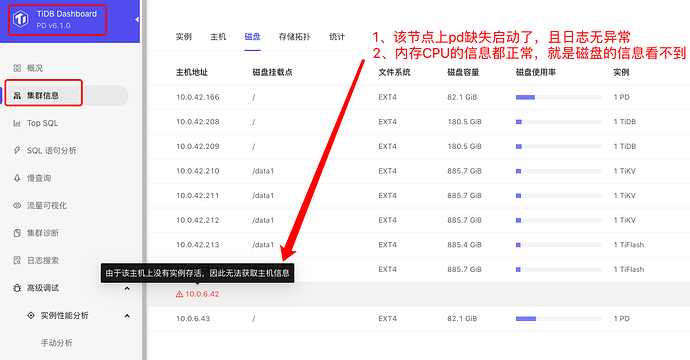
[Problem Encountered] After deploying the cluster using tiup, when entering dashboard → cluster information → disk, the disk information of one PD node does not appear, and an error is reported: “Host information cannot be obtained because there are no instances alive on this host.”
[Reproduction Path] No operations were performed, the issue was seen on the dashboard right after deployment.
[Problem Screenshot]
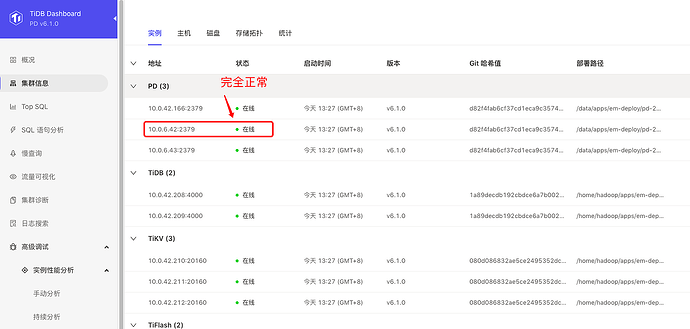
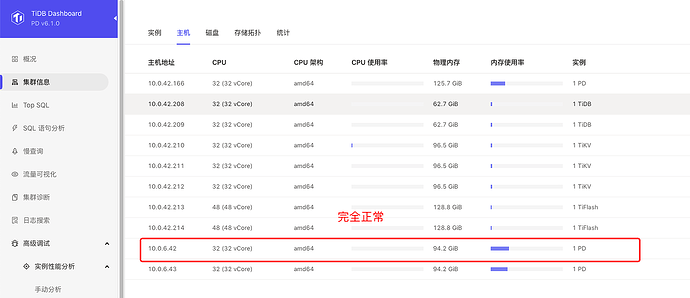
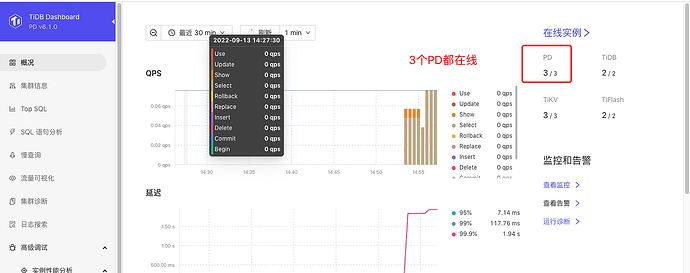
However, everything else is normal, as shown below:
[PD Log File]
pd.log (28.7 KB)
blackbox_exporter.log (764 bytes)
node_exporter.log (11.0 KB)
[Additional Notes]
- The cluster was just deployed, no data, no processing done, the machine is clean.
- There are three PDs, all highly configured, only this one PD has this issue.
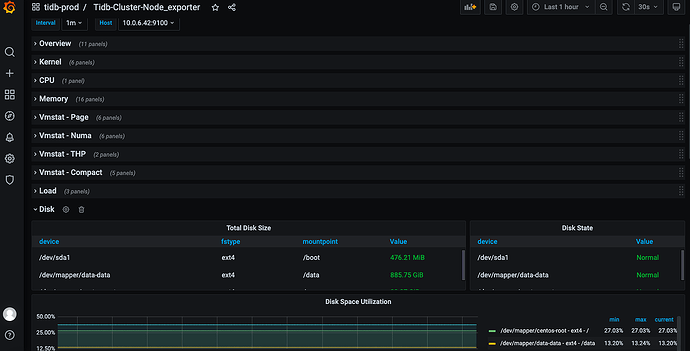
- Disk information can be seen in Grafana, as shown below:
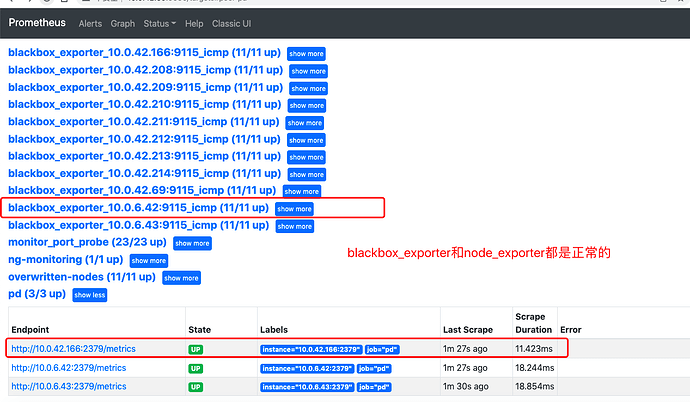
- The blackbox_exporter and node_exporter of this node are also normal, as shown below:
Try restarting the problematic PD node… restart it individually…
Are you suggesting restarting the problematic PD node? Should I restart the service or the machine?
If it is not the leader node, you can restart the machine first, then restart the service.
tiup cluster restart <cluster-name> --node IP:PORT
For now: tiup cluster restart tidb-prod -N 10.0.6.42:2379 doesn’t work, so I’ll try restarting the machine.
After restarting the machine and then restarting the service, it still doesn’t work.
I can confirm that all services are running normally.
Which node’s log are you referring to? Is there any abnormal information?
Check the communication between these nodes…
It should have nothing to do with this error:
- The previous bunch of errors occurred because during the startup phase, this PD was the first to start, and other processes hadn’t started yet. It was just waiting for the next check, and there were no errors afterward.
- The error below occurred after restarting when I accessed the UI again without logging in. It automatically redirected to the login page (I just logged out to the login page, then restarted the service, and logged in directly without encountering this error. The IP 185 is my local machine IP).
At present, it does not affect usage, it just looks uncomfortable and feels like a bug.
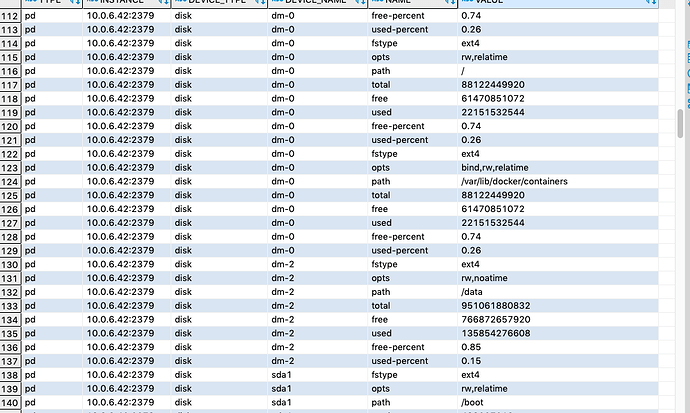
You can check the cluster_hardware view for disk-related information.
- I checked everything, and the disk information is normal.
- I also used the browser’s developer tools to check the returned data, and the disk is also normal.
- After a while, another node also had this issue, so I can confirm that the service is functioning normally.
{
    "host": "10.0.6.42",
    "cpu_info": {
        "arch": "amd64",
        "logical_cores": 32,
        "physical_cores": 32
    },
    "cpu_usage": {
        "idle": 0.96,
        "system": 0
    },
    "memory_usage": {
        "used": 30730096640,
        "total": 101191753728
    },
    "partitions": {
        "/boot": {
            "path": "/boot",
            "fstype": "ext4",
            "free": 324261888,
            "total": 499337216
        },
        "/data": {
            "path": "/data",
            "fstype": "ext4",
            "free": 766832631808,
            "total": 951061880832
        },
        "/var/lib/docker/containers": {
            "path": "/var/lib/docker/containers",
            "fstype": "ext4",
            "free": 61470498816,
            "total": 88122449920
        }
    },
    "instances": {
        "10.0.6.42:2379": {
            "type": "pd",
            "partition_path_lower": ""
        }
    }
}
Hello, there are currently no clear logs available for this issue. Based on the description, it seems to be related to a dashboard collection problem. It is recommended to collect the check information of tiup cluster to see if the OS configuration is suboptimal.
