Note:
This topic has been translated from a Chinese forum by GPT and might contain errors.
Original topic: 查询时,不同的limit 效率相差极大
[TiDB Usage Environment] Production Environment
[TiDB Version] v5.4.0
[Reproduction Path] A query statement
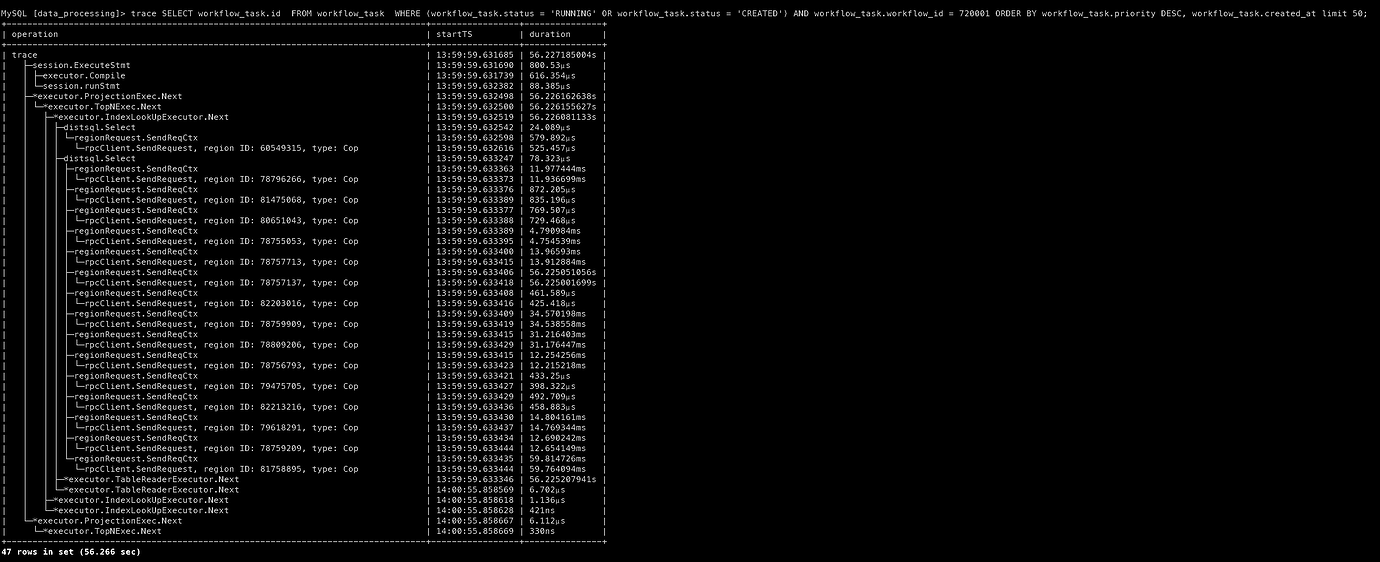
SELECT workflow_task.id FROM workflow_task WHERE (workflow_task.status = 'RUNNING' OR workflow_task.status = 'CREATED') AND workflow_task.workflow_id = 720001 ORDER BY workflow_task.priority DESC, workflow_task.created_at LIMIT 50;
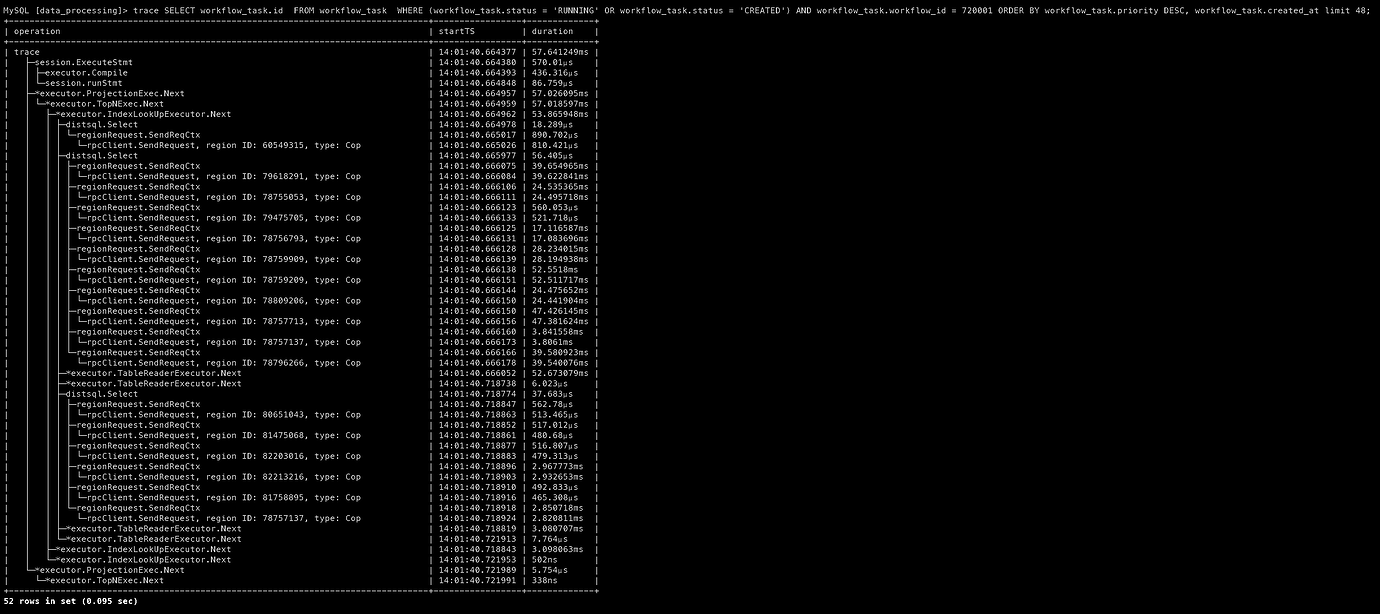
When the limit is 48 or below, the query returns instantly. When the limit is 49 or above, it takes 30 minutes or never returns…
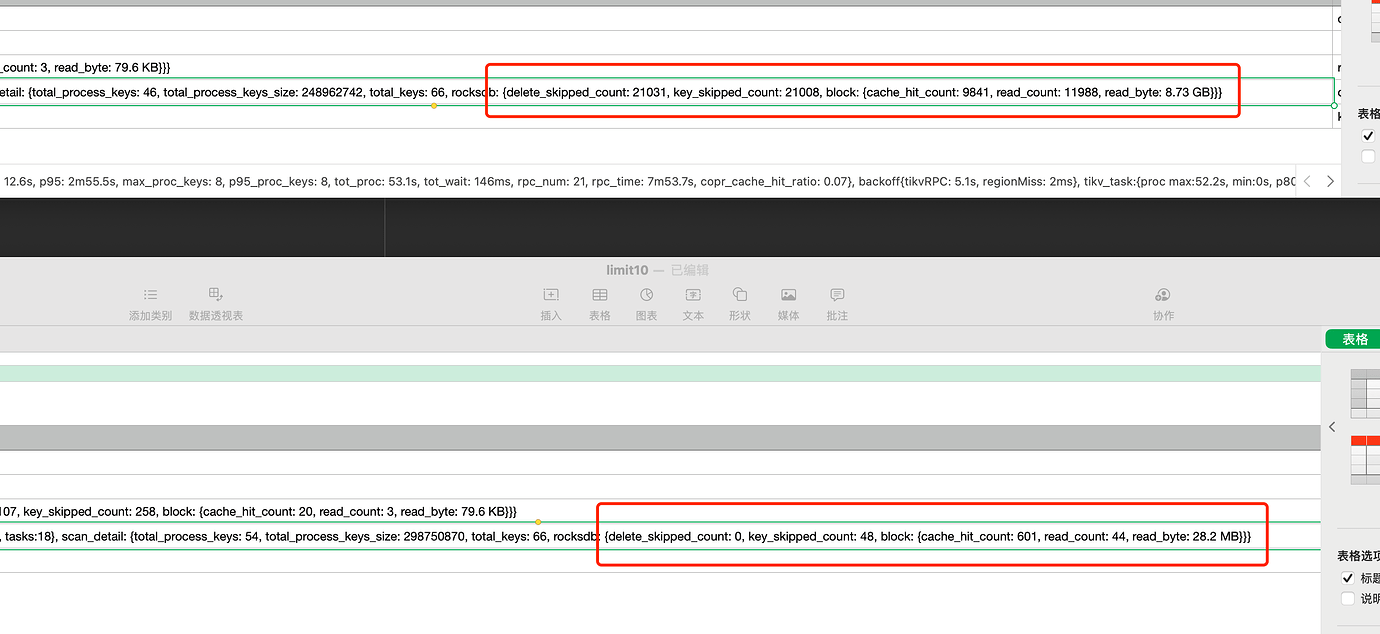
I captured two execution plans and noticed some anomalies in RocksDB actions when the limit is 50.
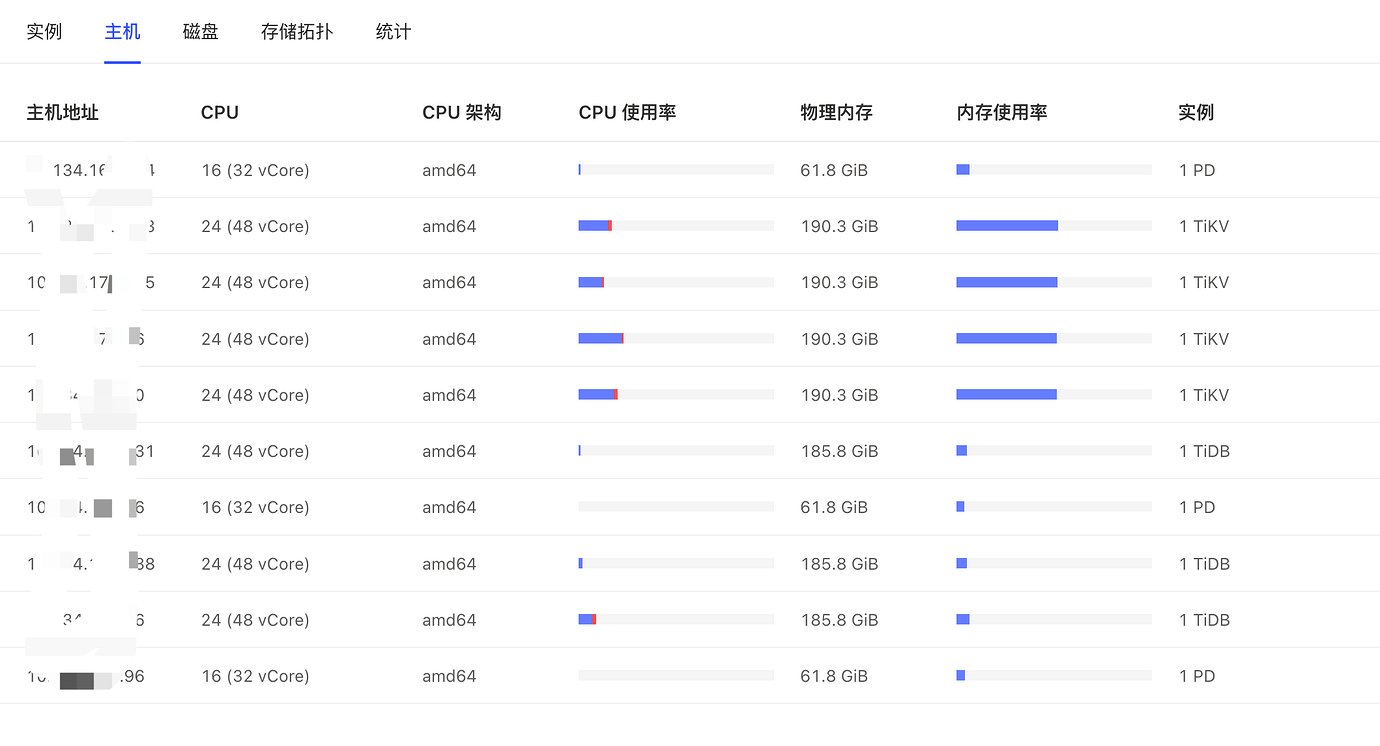
Additionally, TiKV was previously upgraded from 32c64g to 48c192g.
Below are the traces for comparison, though I’m not sure if they are helpful.
The target table has 3.4 million rows, and there are 54 rows that match the above query (without limit). The analyze table command was run, but there was no significant change. One detail is that the stat healthy was 84 last night and dropped to 49 this morning. The business reports about a million update operations daily.
[Resource Configuration] Go to TiDB Dashboard - Cluster Info - Hosts and take a screenshot of this page
[Attachments: Screenshots/Logs/Monitoring]
Attached are the execution plans
limit10.csv (2.0 KB)
limit50.csv (2.0 KB)
What is the GC time of the database? Are there millions of updates every day? Is there any pattern to the updated data?
The GC life time is 10 minutes. It is temporarily impossible to assess whether the updates are regular, and the business has only captured one counter.
Looking at your execution plan for limit 50: delete_skipped_count: 21031. Is it possible that there is a lot of GC data in this table that hasn’t been cleaned up in time? When querying limit 50, there is too much GC data to filter through.
Is there a way to verify this hypothesis?
Also, why is there such a big difference in delete_skipped_count between limit50 and limit10? They should be following the same plan…
When using “ORDER BY” with “LIMIT,” you can check the distribution of data for limits 49 and above. Are they objects that are updated daily?
Without the limit, there are a total of 54 records, which doesn’t really qualify as distribution… But there are daily updates, and the number of updated rows is not strongly correlated with 48 or 49.
Can you check if the monitoring of the GC safe point is progressing normally?
Try removing your sorting fields. I feel that the data sorted by this might be causing the issue. Many corresponding data might have been deleted or modified, causing RocksDB to scan too much data when you limit to 50.
Implement soft deletion by using a separate field to record whether the entry is deleted.
Then, create a composite index using other fields, such as the primary key and this record status field, to achieve index scattering and filtering. This will significantly improve efficiency (if you use this record status field alone as the index key, it may cause hotspot index issues, so be cautious).
Alternatively, you can use partitioning. Data cleanup can be done through truncating partitions, which can also improve efficiency (it will hardly affect the efficiency of limit queries).
Removing the sorting makes it instant, but this sorting + limit is part of the business logic~
SHOW config WHERE TYPE=‘tikv’ AND NAME LIKE ‘%enable-compaction-filter%’, check what this parameter is, if it’s false, change it to true.
Additionally, you can configure the amount of data for each GC, which may have some impact on cluster performance, so it’s not recommended to set it too large.
tikv-ctl --host=ip:port modify-tikv-config -n gc.max-write-bytes-per-sec -v 10MB
All four TiKV nodes have the enable-compaction-filter parameter set to true.
Should the write bytes per sec 10MB be increased or decreased? Currently, the IO utility of all our TiKV nodes exceeds 95%. I don’t feel confident about the final step, so let’s not change this parameter for now.
The same region top50
top48
The time difference is surprisingly large.
Additionally, top50
read_byte: 8.73 GB delete_skipped_count: 21031
top10
read_byte: 28.2 MB delete_skipped_count: 0
It might have something to do with GC.
Below limit 48, it consistently outputs in seconds…
Above 50, it’s all about luck…
As for GC, shouldn’t it treat everything equally…
Your GC graph is really not normal. This is mine. The difference is quite obvious.
tikv-ctl --host=tikv_ip:port region-properties -r 81758895 and 78757137 to check
After reading it, I realized that all the experts are helping you, hahaha, so impressive.
So, how should I dig into it?