Note:
This topic has been translated from a Chinese forum by GPT and might contain errors.
Original topic: TIDB的IO使用率总是很高,但实际磁盘IO并不高,求解
【TiDB Usage Environment】Production Environment
【TiDB Version】6.10
【Reproduction Path】What operations were performed when the issue occurred
【Encountered Issue: Issue Phenomenon and Impact】
【Resource Configuration】Go to TiDB Dashboard - Cluster Info - Hosts and take a screenshot of this page
【Attachments: Screenshots/Logs/Monitoring】
The IO on the TiDB console is often maxed out
But the backend disk monitoring shows read/write speeds below 100M/S
Can any expert analyze the reason?
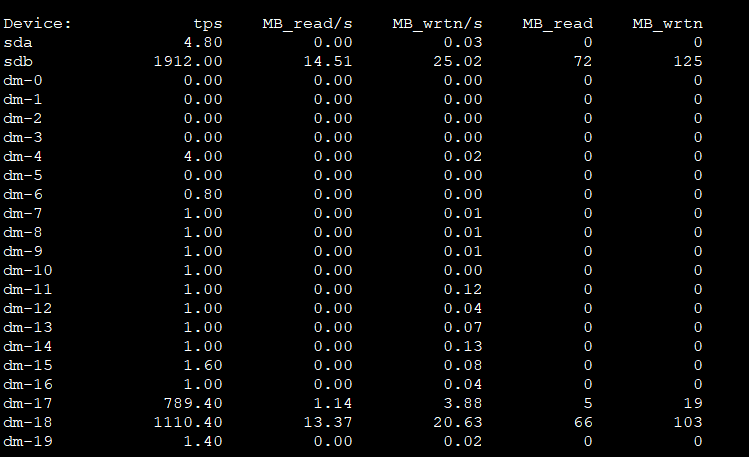
IOPS has already reached 2000, which is the bottleneck for mechanical drives. Read/write speed is 25MB/s.
Even if you make everything direct pass-through, the performance will be much better.
Is it the node machine corresponding to 100% IO?
The disk performance is a bit poor. If you switch to SSD, it will be like mine, fully utilized but very stable.
Print a screenshot of iostat to see if there is any wait. We are looking at TPS, not MB/S.
Is it a mechanical disk? Check the disk latency.
It is best to switch to NVME disks.
Using iostat -x 30 to look at the last column, you can see the actual busy level of the disk.
What data disk are you using? Do you have a comparison of specific node time periods?
It seems that the disk is too poor.
It’s okay to replace the disk.
My virtual machine’s disk is like this too.
If the front-end service is affected, switch to a high-performance server.
You are using a mechanical hard drive.
Take a look at what TiDB’s monitoring interface uses to determine IO load, then compare what you are looking at with TiDB’s data collection rules to see if they refer to the same thing.


