Note:
This topic has been translated from a Chinese forum by GPT and might contain errors.Original topic: tidb dashboard中信息含义
[TiDB Usage Environment] Production Environment
[TiDB Version] 6.5.10
[Encountered Problem: Phenomenon and Impact]
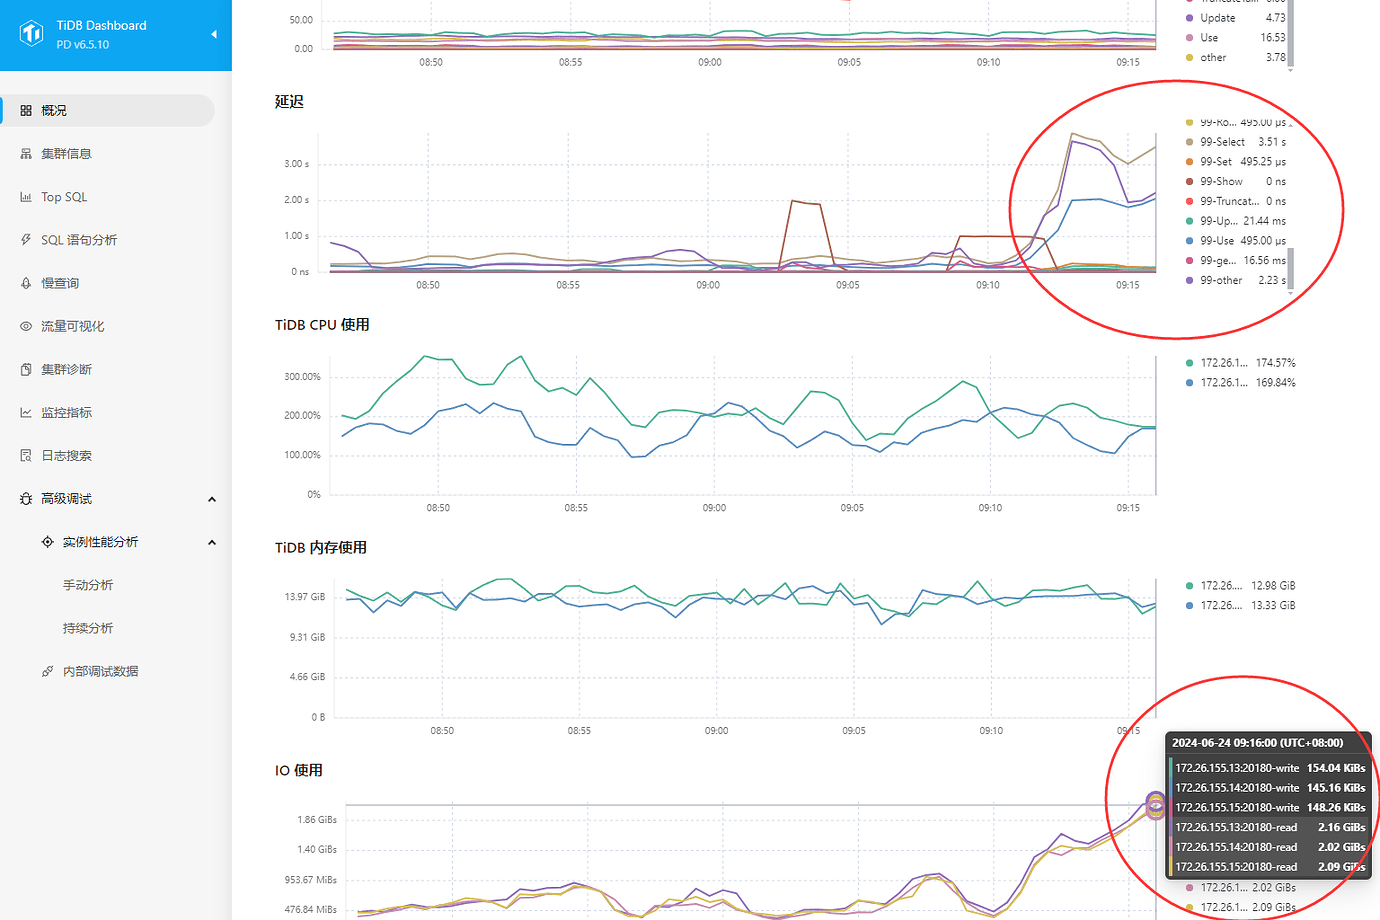
Beginner’s question: In the overview information of the TiDB dashboard, what does the tikv read 1GiBs shown under IO usage mean?
When I use iotop to check disk read and write, they are very small, just a few hundred K or a few M. Why does it show so much here?
Based on this read and write volume, what IOPS should I use for the disk? What is the appropriate throughput?
Is high latency positively correlated with IO usage?