Note:
This topic has been translated from a Chinese forum by GPT and might contain errors.
Original topic: TiDB-v6.1.0的tidb-server内存占用不断升高,每天升高20g,直至达到内存阈值服务重启,开始下一轮循环
【TiDB Usage Environment】Production environment
【TiDB Version】v6.1.0
【Encountered Problem】The memory usage of tidb-server keeps increasing, frequently causing restarts
【Reproduction Path】After upgrading from tidb5.2.3 to 6.1.0, a new business line with large batch data writes was introduced, significantly increasing the load compared to before, and this problem appeared
【Problem Phenomenon and Impact】
Due to business needs, a large number of tables are batch written every day using JDBC batch writes. The specific parameters are as follows:
jdbc:mysql://***********:4000/database?useConfigs=maxPerformance&useServerPrepStmts=true&rewriteBatchedStatements=true&allowMultiQueries=true&prepStmtCacheSize=2000
Problem Phenomenon: tidb frequently restarts. After observation, the memory usage of tidb-server increases by 20GB daily, eventually reaching the memory limit, causing the node to restart. After restarting, the memory usage will still gradually increase, falling into a loop.
Impact: The batch write task generally runs for about 10 minutes. During the write period, node restarts will result in connection refusal, causing task failure.
TiDB memory monitoring: To avoid business impact, this time it was manually restarted. After restarting, the memory still increases, as shown in the figure below:
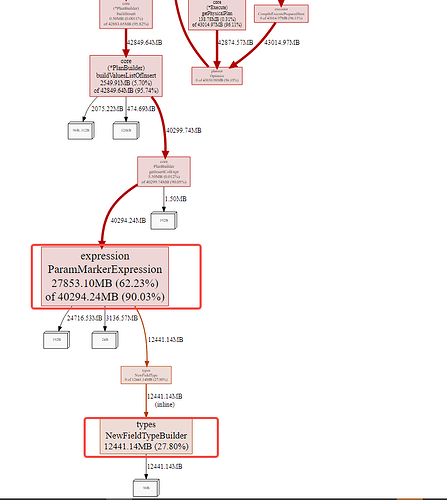
The heap relationship diagram of the TiDB dashboard node is as follows:
From the usage situation, it is obvious that the expression ParamMarkerExpression and types NewFieldTypeBuilder occupy nearly 89% of the memory. These two parts should be used when writing with the prepare method, generating memory usage when replacing specific field values.
Solution Ideas:
- Are there any parameters to set the memory usage size of these two parts?
- Release the used memory in a timely manner
What does your SQL execution plan look like? Is it very complex?
No need to look, no need to ask. This TiDB OOM is a normal phenomenon. Check the slow SQL being executed on the dashboard console, which has high memory usage. Limit this SQL by setting two parameters: one for execution time and one for memory size. After setting, restart the TiDB server.
set global max_execution_time=2000;
Set tidb_mem_quota_query=1073741824 globally;
After setting these two parameters, you need to restart each TiDB instance that experienced OOM. Once restarted, OOM should no longer occur. Then, check the logs for the blocked SQL queries. These queries are slow SQLs that caused the database to hang.
You can check if it is enabled. If it is, it might be an issue with tidb_enable_prepared_plan_cache. You can try turning it off first to see if it helps.
tidb_enable_prepared_plan_cache introduced from version v6.1.0
- Scope: GLOBAL
- Persisted to the cluster: Yes
- Default value:
ON
- This variable controls whether to enable the Prepared Plan Cache. When enabled, the execution plans for
Prepare and Execute requests will be cached, allowing subsequent executions to skip the query plan optimization step, thus improving performance.
- Before v6.1.0, this switch was configured through the TiDB configuration file (
prepared-plan-cache.enabled). When upgrading to v6.1.0, the original settings will be automatically inherited.
In the slow SQL, there are system ANALYZE TABLE and business-related insert into values() and delete from these SQLs. The memory increase caused by complex SQL is usually instantaneous or short-lived, and the memory drops back after the SQL stops or is killed. The problem we are encountering now is a continuous increase in memory during long-term stable use, gradually increasing bit by bit.
Are the two parameters referring to the memory limit for a single SQL and the execution time for a single SQL?
The maximum memory for a single SQL has been configured to 4GB, but the maximum execution time for a single SQL has not been set.
It’s caused by slow SQL. If you resolve the slow SQL, the TiDB memory will no longer gradually increase.
I also think it’s a slow SQL. You can show the memory sorting SQL from the dashboard.
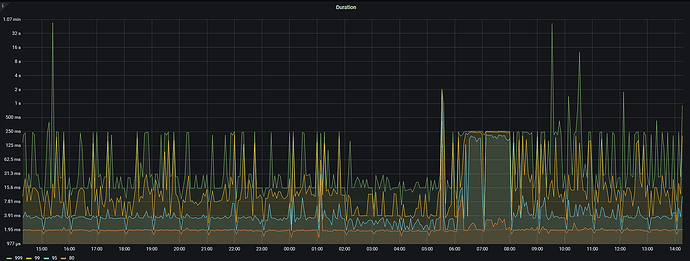
Please share a screenshot of the duration from Grafana TiDB.
The maximum memory for a single SQL has been set, and there is no limit on the maximum execution time. However, when I check the running SQL in TiDB, each node has about 20 or so, and I haven’t found any excessively long execution times. Most are a few hundred seconds, with a few around 2000 seconds.
The image is not visible. Please provide the text you need translated.
Memory sorting has been posted above!
Thank you, the parameter here is enabled by default. I’ll try turning it off and see.
Look at this picture, it’s not a slow SQL issue, it’s a problem with the entire cluster. It could be hardware, it could be parameters, affecting the whole system. You can check it based on this link:
读性能慢-总纲 - TiDB 的问答社区.
Okay, thank you, I will check it out.
Thank you very much for the ideas and suggestions provided by everyone. The problem has basically been identified, and I would like to provide some feedback here.
The continuous increase in memory is indeed due to the default enabling of tidb_enable_prepared_plan_cache in v6.1.0, which causes the execution plan cache to gradually increase memory usage. The reserved memory parameter tidb_prepared_plan_cache_memory_guard_ratio has a threshold that is too small, defaulting to 0.1, allowing the plan cache to occupy up to 90%.
If there are large SQL queries or high concurrency near the threshold, the instantaneous memory usage may reach the maximum memory limit of the tidb-server, causing the tidb-server node to restart. Currently, by manually releasing the node plan cache with ADMIN FLUSH INSTANCE PLAN_CACHE, the node memory immediately drops below 10GB. The plan is to increase the reserved memory parameter tidb_prepared_plan_cache_memory_guard_ratio.
I found the solution to my problem. Thank you very much for providing the idea. It was indeed an issue with the plan_cache. I adjusted the threshold and will observe it further. Thanks again.
This topic was automatically closed 60 days after the last reply. New replies are no longer allowed.


