Note:
This topic has been translated from a Chinese forum by GPT and might contain errors.
Original topic: PD的mvcc_db_total_size过大
[TiDB Usage Environment] Production Environment
[TiDB Version] v4.0.11
[Reproduction Path] None
[Encountered Problem: Phenomenon and Impact]
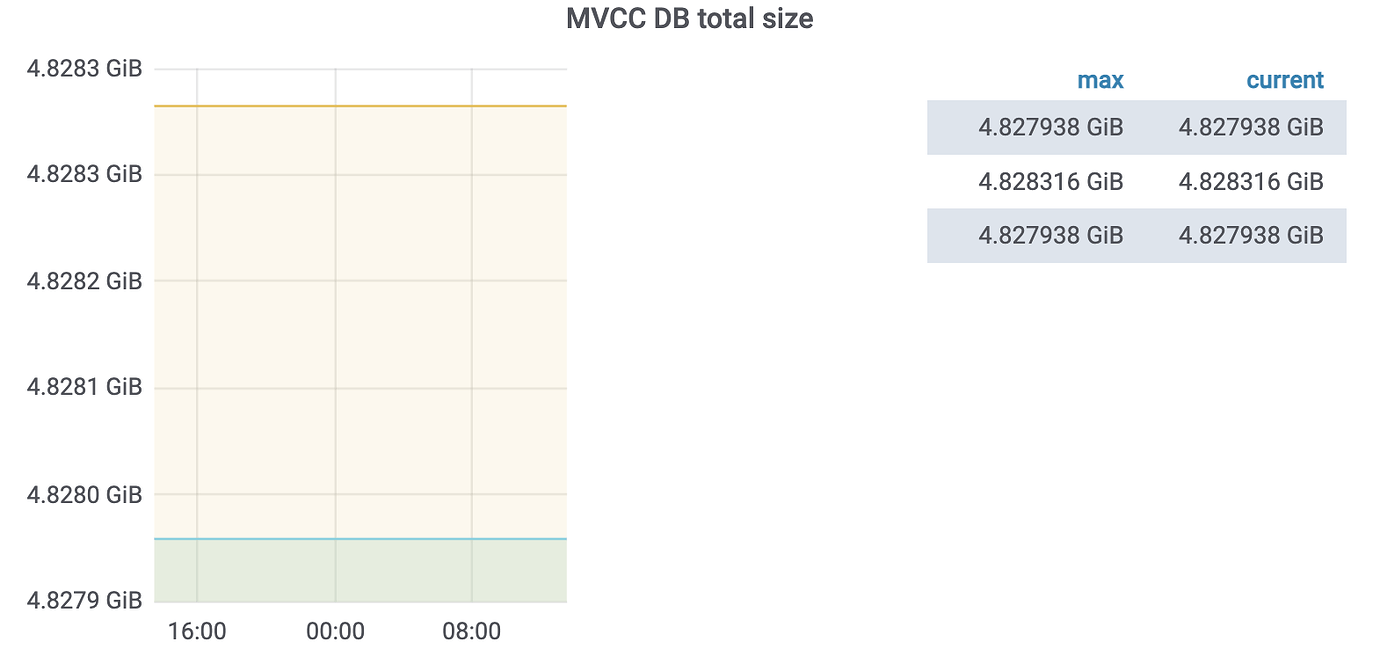
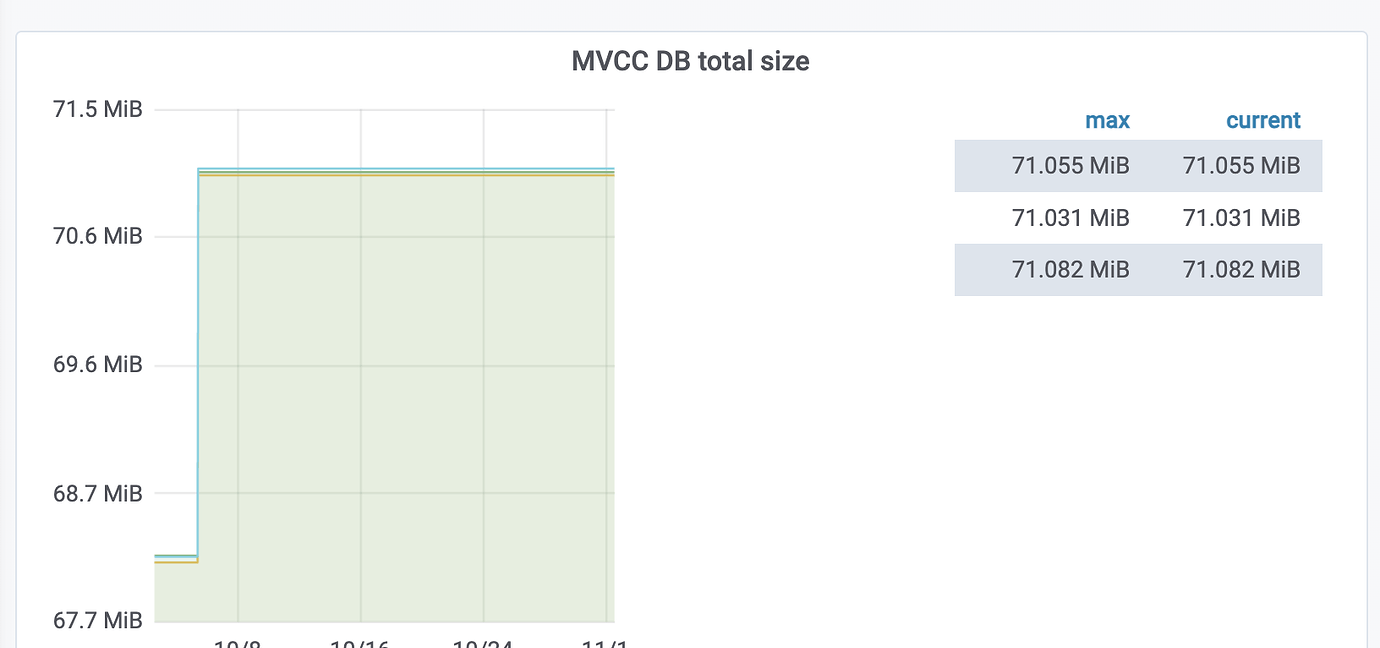
There are two clusters, primary and secondary (A and B). Data consistency is maintained through dual writes by the service provider and TiCDC. However, it was recently discovered that the mvcc_db_total_size of cluster B has reached around 5G, while cluster A is less than 100M.
I would like to understand the possible reasons and how to reduce it.
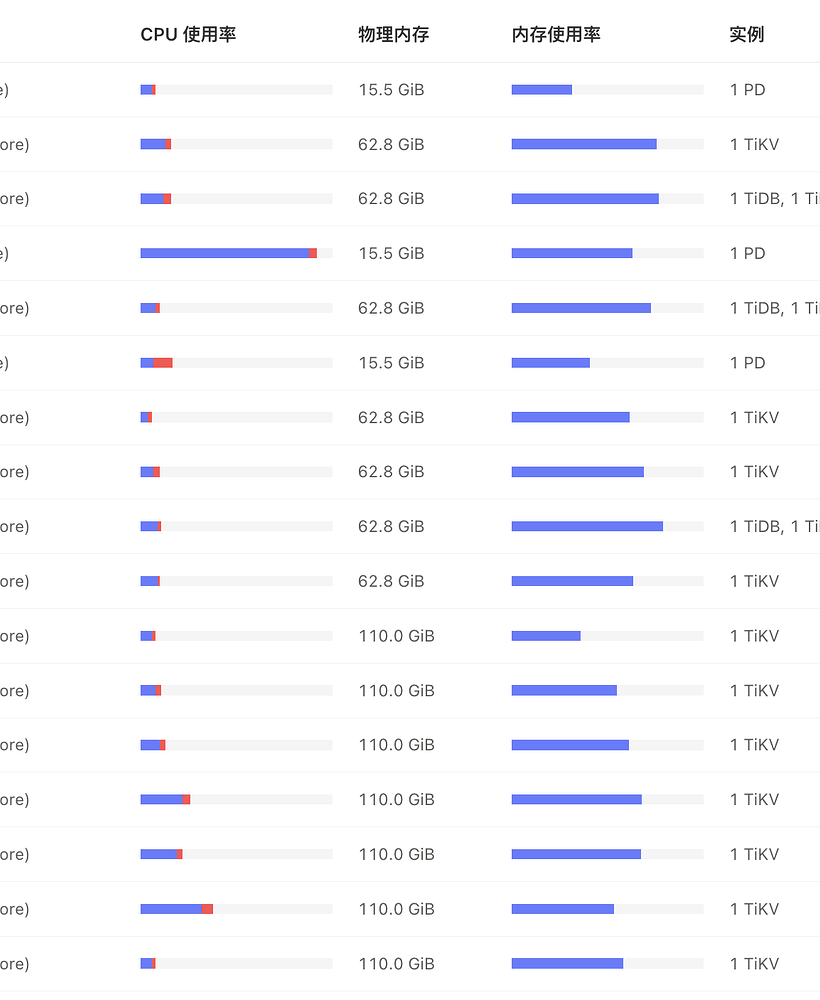
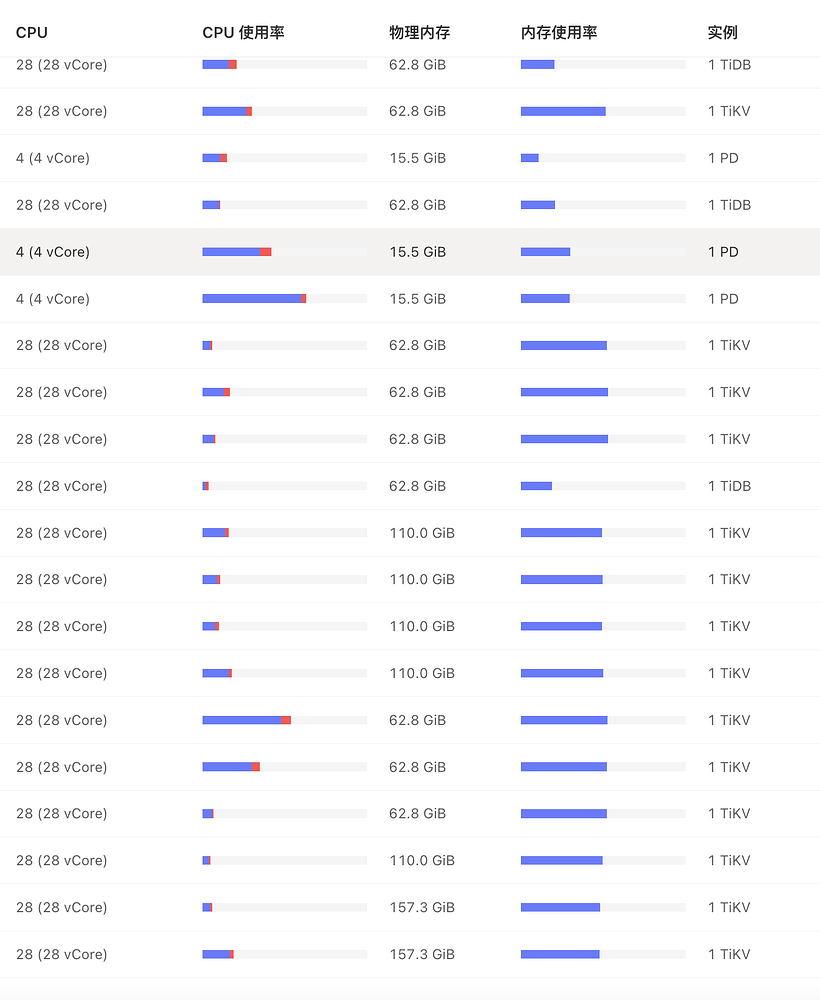
[Resource Configuration]
[Attachments: Screenshots/Logs/Monitoring]
Check if the GC configurations of the two clusters are consistent…
I looked at the PD configuration
High ETCD cluster
  pd:
    auto-compaction-mode: revision
    auto-compaction-retention: "5"
    log.file.max-days: 3
    schedule.leader-schedule-limit: 4
    schedule.region-schedule-limit: 2048
    schedule.replica-schedule-limit: 64
Normal cluster
  pd:
    auto-compaction-mode: revision
    auto-compaction-retention: "5"
    log.file.max-days: 7
    quota-backend-bytes: 17179869184
    schedule.leader-schedule-limit: 4
    schedule.region-schedule-limit: 2048
    schedule.replica-schedule-limit: 64
So it looks like the only difference is quota-backend-bytes, which is the metadata storage size. The default value is 8G, but it seems that the normal cluster is actually larger.
You checked the wrong place, check this
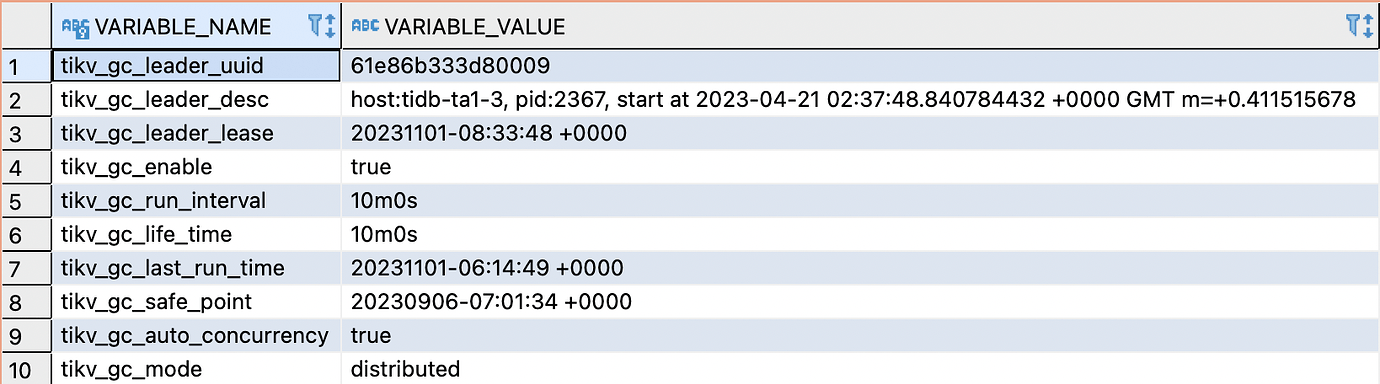
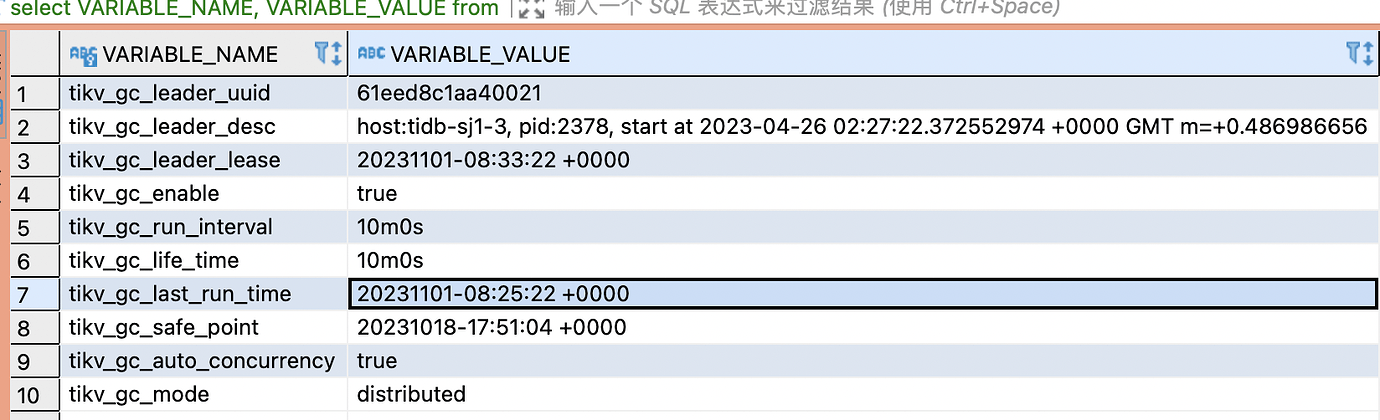
It looks like the tikv_gc_safe_point is quite strange. Normally, the interval between the current time and the last run is 2 weeks, but for the high ETCD cluster, the interval is 8 weeks.
Then you need to check why the GC didn’t execute. Look at the logs to see where it got stuck or what happened.
It seems there is an issue with CDC, as the safe point remains unchanged. After restarting several nodes, the safe point points to the current time, but it appears that ETCD has not changed. Does this need to wait for the next GC?
The GC safe point time is today, and it has changed compared to the previous one.
If GC is functioning normally, the MVCC version information will be cleaned up properly; it just needs more time.
If GC is not functioning normally, you can troubleshoot the GC issues.
This issue might be a bug in the lower version of CDC. We recently encountered a similar problem where too much etcd metadata occupied the space of the PD cluster.
It looks like 24 hours have passed since the GC recovery, but ETCD is still very high. I understand that there should be other reasons causing this. Could it be related to the high number of empty regions and the number of regions? I understand that if ETCD stores meta info, this is quite possible.
I found that the stopping of the GC safepoint is definitely related to CDC because the stopping time coincides exactly with the TSO of a stopped CDC task. After cleaning up the CDC task, the GC returned to normal, but there was still no change in ETCD.
Empty regions can be merged… This can reduce resource usage and speed up the process~
What is the upstream CDC version? Lower versions of CDC have bugs. Refer to this: TiCDC 常见问题和故障处理 | PingCAP 文档中心
Is it the CDC task that is affecting it?
It doesn’t seem to be the version mentioned in the documentation
Release Version: v4.0.11
Git Commit Hash: 52a6d9ea6da595b869a43e13ae2d3680354f89b8
Git Branch: heads/refs/tags/v4.0.11
UTC Build Time: 2021-02-25 16:40:37
Go Version: go version go1.13 linux/amd64
It should have been before, but after cleaning up the CDC tasks, the GC safepoint has returned to normal. However, the ETCD size still remains around 5G without any change.