Note:
This topic has been translated from a Chinese forum by GPT and might contain errors.
Original topic: pd-server一直打印[cluster.go:586] [“leader changed”] [region-id=xxx] [from=7] [to=6],tikv一直打印 [raft.rs:1242] [“broadcasting vote request”]
【TiDB Usage Environment】Production Environment
【TiDB Version】v5.0.1
【Reproduction Path】No operations were performed, the issue suddenly appeared
【Encountered Problem: Symptoms and Impact】Select queries are particularly slow, even for small tables of KB size, it takes several minutes to query.
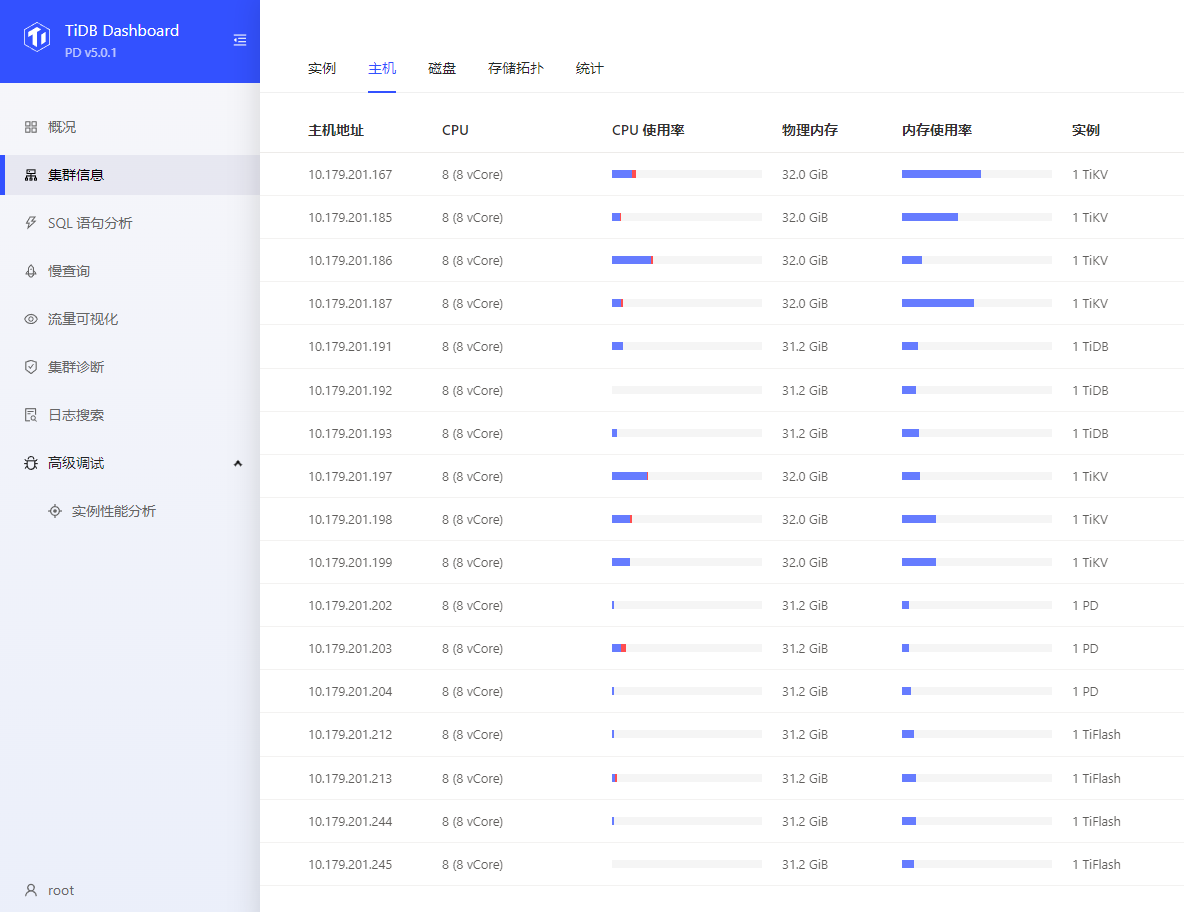
【Resource Configuration】Go to TiDB Dashboard - Cluster Info - Hosts and take a screenshot of this page
【Attachments: Screenshots/Logs/Monitoring】
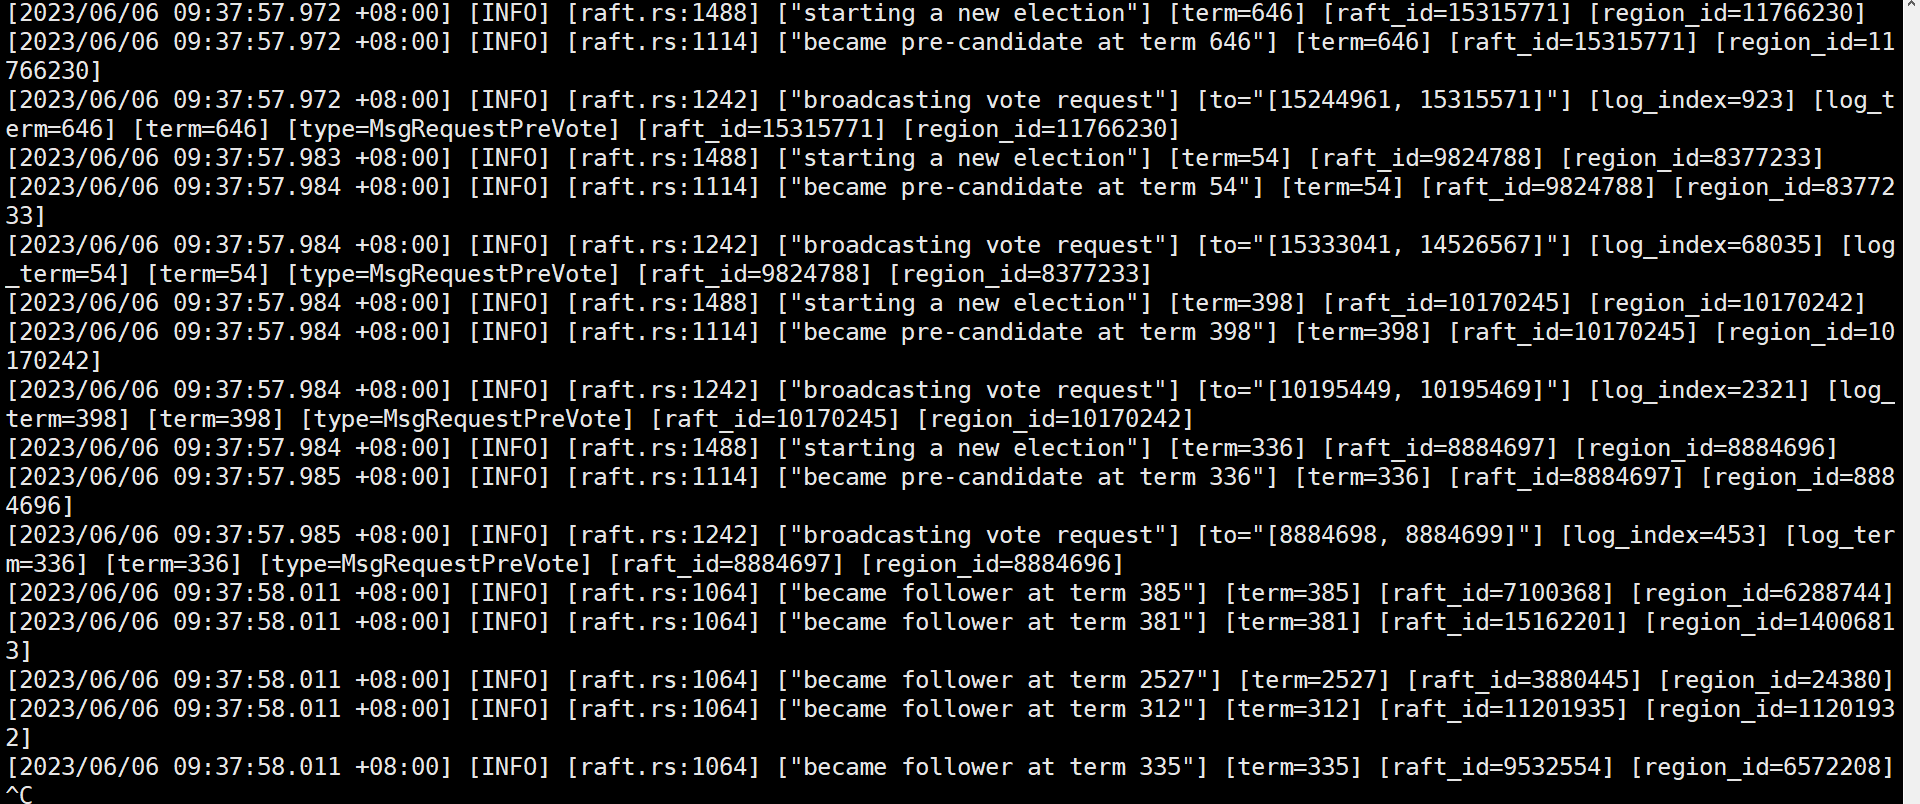
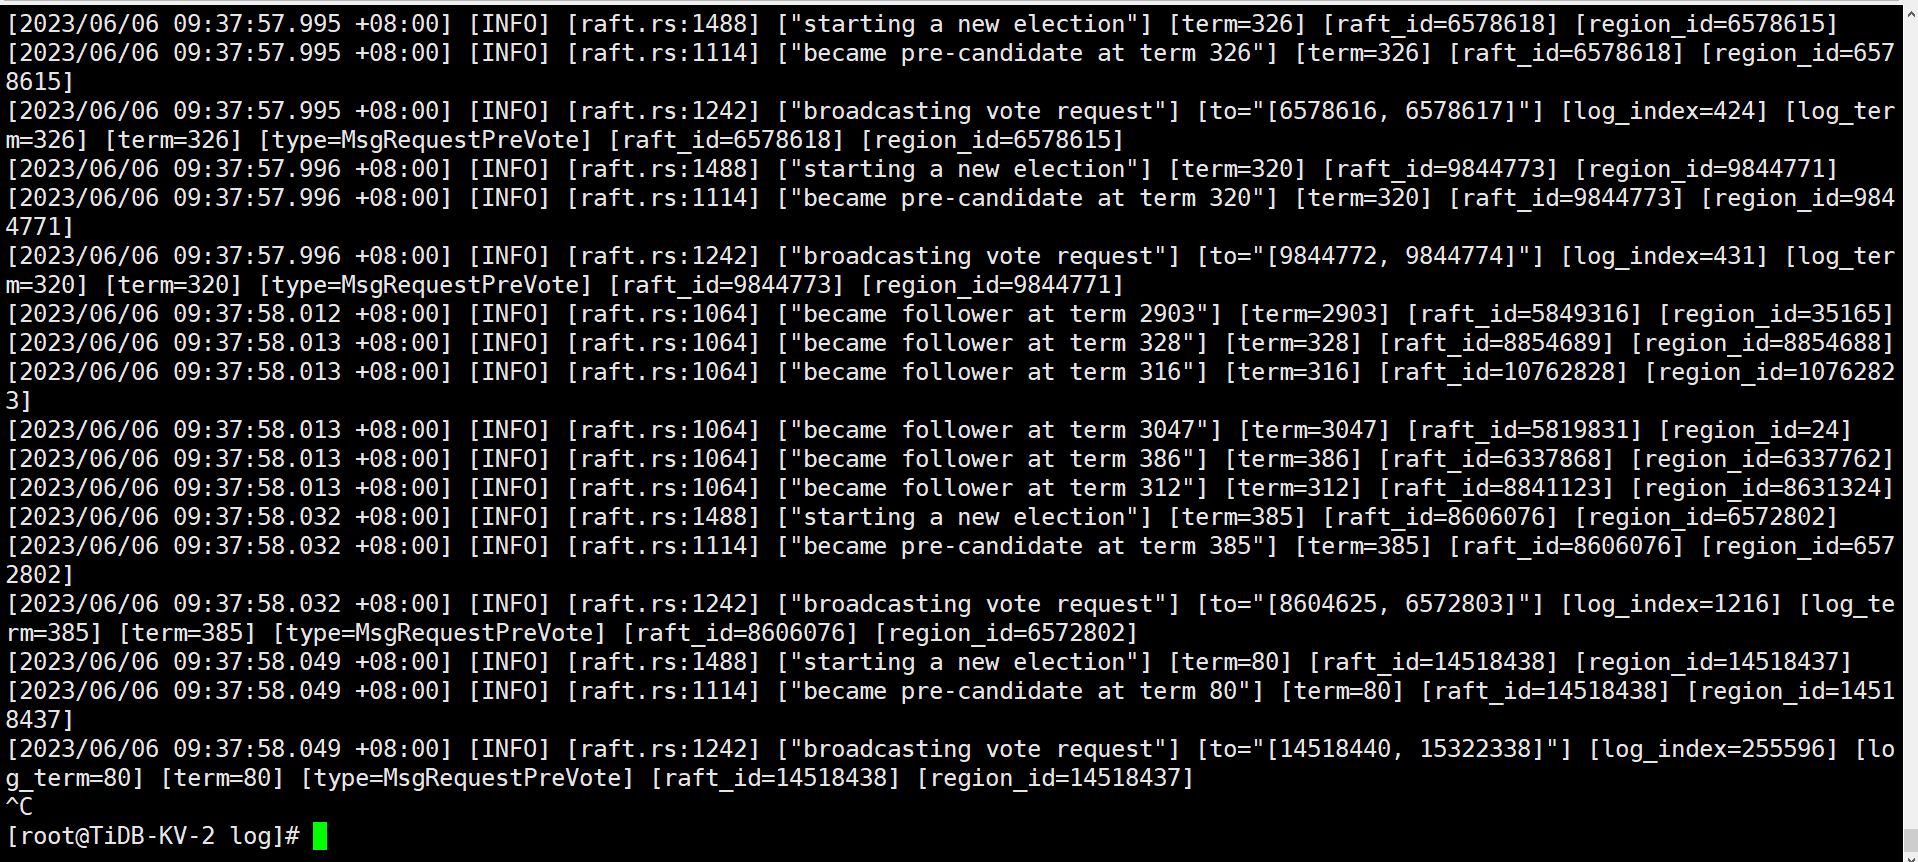
TiKV logs are as follows:
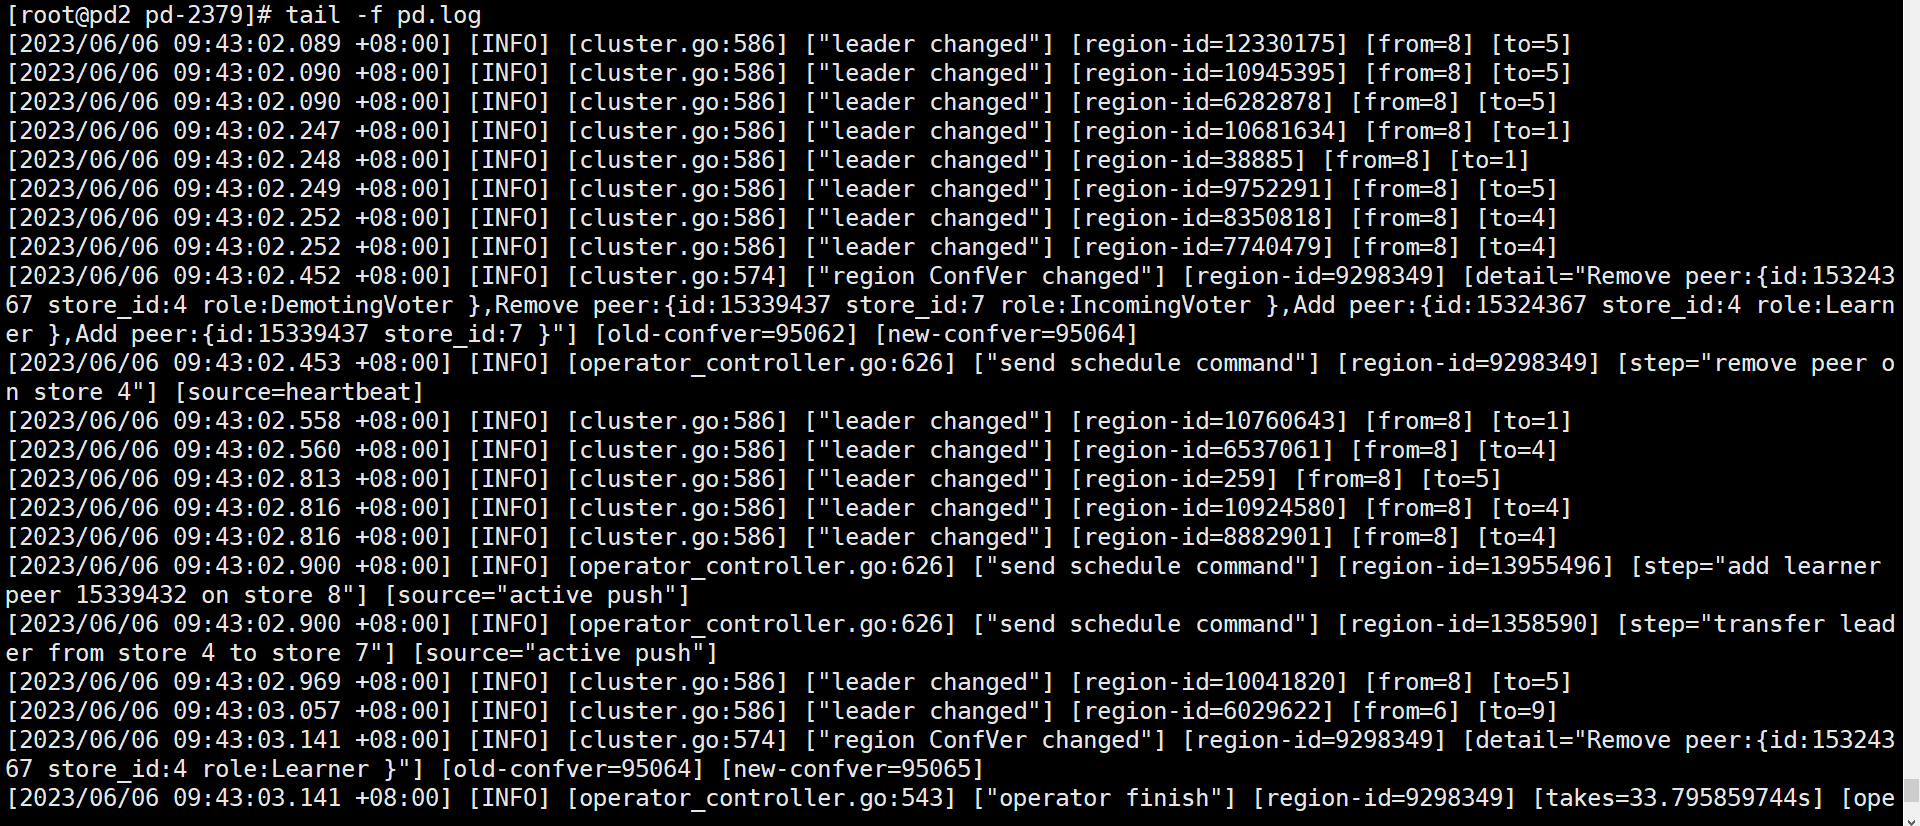
PD-server logs are as follows:
The logs are all info, you can ignore them.
You need to provide the slow scenarios for analysis.
I can’t view images directly. Please provide the text you need translated.
The business doesn’t have very complex SQL queries. Previously, select queries were very fast, but now selecting a regular table is extremely slow. Although these logs are all info level, similar logs are being printed continuously.
A detailed analysis may require uploading logs and monitoring sets, but this phenomenon is somewhat similar to the space utilization rate exceeding the preset ratio. You can first rule this out by checking the low/high space ratio displayed in pdctl to see if the store space utilization rate exceeds the set value.
I’ll first upload the pd.log and tikv.log for you to check. I’ll rule out the possibility of space utilization exceeding the preset ratio on my end.
tikv.log (27.0 MB)
pd.log (6.5 MB)
Check the execution plan to investigate where exactly it’s slow.
However, mysql is a system table, and the SQL you identified is a query for collecting statistics for system histograms…
Does this significantly affect your business service?