The performance of the Sort operator writing to disk is too slow, and we hope for optimization at the product level

Note:
This topic has been translated from a Chinese forum by GPT and might contain errors.

Original topic: Sort算子落盘性能太慢,希望产品层面进行优化

| username: 人如其名

[Problem Scenario Involved in the Requirement]
During the performance testing of traditional databases and TiDB databases, regarding sorting, as long as it involves disk spilling, TiDB’s performance will have a significant discount.

Here, we use the open-source database PostgreSQL (referred to as: pg) as a test case to compare the performance of the sort operator. The comparison methods are:

  1. Single-threaded in-memory sorting, observing efficiency.
  2. Single-threaded disk spill sorting, observing efficiency.
  3. pg multi-threaded disk spill sorting, observing efficiency. (pg’s in-memory sorting method is quicksort, which does not support parallelism, while disk spill sorting supports parallelism)
    Other notes: TiDB does not support parallel sorting, so only single-threaded tests are conducted.

The table structure and data volume are as follows:

mysql> show create table customer \G
*************************** 1. row ***************************
       Table: customer
Create Table: CREATE TABLE `customer` (
  `C_CUSTKEY` bigint(20) NOT NULL,
  `C_NAME` varchar(25) NOT NULL,
  `C_ADDRESS` varchar(40) NOT NULL,
  `C_NATIONKEY` bigint(20) NOT NULL,
  `C_PHONE` char(15) NOT NULL,
  `C_ACCTBAL` decimal(15,2) NOT NULL,
  `C_MKTSEGMENT` char(10) NOT NULL,
  `C_COMMENT` varchar(117) NOT NULL,
  PRIMARY KEY (`C_CUSTKEY`) /*T![clustered_index] CLUSTERED */,
  KEY `customer_idx1` (`C_PHONE`),
  KEY `customer_idx2` (`C_NATIONKEY`)
) ENGINE=InnoDB DEFAULT CHARSET=utf8mb4 COLLATE=utf8mb4_bin
1 row in set (0.00 sec)

mysql> select count(*) from customer;
+----------+
| count(*) |
+----------+
|  1500000 |
+----------+
1 row in set (0.56 sec)

1. Single-threaded in-memory sorting, observing efficiency.
TiDB:

Set the statement memory size to 1GB, table scan concurrency to 1;

set tidb_distsql_scan_concurrency=1;
set tidb_mem_quota_query=1073741824;

mysql> explain analyze select * from customer order by C_COMMENT desc, C_ACCTBAL asc;
+-------------------------+------------+---------+-----------+----------------+------------------------------------------------------------------------------------------------------------------------------------------------------------------------------------------------------------------------------------------------------------------------------------------------------+-------------------------------------------------------+----------+---------+
| id                      | estRows    | actRows | task      | access object  | execution info                                                                                                                                                                                                                                                                                       | operator info                                         | memory   | disk    |
+-------------------------+------------+---------+-----------+----------------+------------------------------------------------------------------------------------------------------------------------------------------------------------------------------------------------------------------------------------------------------------------------------------------------------+-------------------------------------------------------+----------+---------+
| Sort_4                  | 1500000.00 | 1500000 | root      |                | time:7.26s, loops:1466                                                                                                                                                                                                                                                                               | tpch.customer.c_comment:desc, tpch.customer.c_acctbal | 351.5 MB | 0 Bytes |
| └─TableReader_8         | 1500000.00 | 1500000 | root      |                | time:1.86s, loops:1471, cop_task: {num: 8, max: 445.5ms, min: 67.7ms, avg: 231.2ms, p95: 445.5ms, max_proc_keys: 297022, p95_proc_keys: 297022, tot_proc: 1.32s, tot_wait: 2ms, rpc_num: 8, rpc_time: 1.85s, copr_cache: disabled, distsql_concurrency: 1}                                           | data:TableFullScan_7                                  | 128.9 MB | N/A     |
|   └─TableFullScan_7     | 1500000.00 | 1500000 | cop[tikv] | table:customer | tikv_task:{proc max:173ms, min:34ms, avg: 110.3ms, p80:172ms, p95:173ms, iters:1502, tasks:8}, scan_detail: {total_process_keys: 1500000, total_process_keys_size: 305225771, total_keys: 1500008, get_snapshot_time: 6.43ms, rocksdb: {key_skipped_count: 1500000, block: {cache_hit_count: 5035}}} | keep order:false                                      | N/A      | N/A     |
+-------------------------+------------+---------+-----------+----------------+------------------------------------------------------------------------------------------------------------------------------------------------------------------------------------------------------------------------------------------------------------------------------------------------------+-------------------------------------------------------+----------+---------+
3 rows in set (7.27 sec)

It can be seen that the copTask in the tikv-client cache size is 128MB, the sorting is all done in memory, using 351MB, and the total memory usage of the statement is about 500MB.

The test situation in pg is as follows:

tpch=# explain analyze select * from customer order by C_COMMENT desc, C_ACCTBAL asc;
                                                         QUERY PLAN                                                         
----------------------------------------------------------------------------------------------------------------------------
 Sort  (cost=206554.90..210304.40 rows=1499799 width=167) (actual time=12918.633..13180.047 rows=1500000 loops=1)
   Sort Key: c_comment DESC, c_acctbal
   Sort Method: quicksort  Memory: 439757kB
   ->  Seq Scan on customer  (cost=0.00..52702.99 rows=1499799 width=167) (actual time=0.005..111.692 rows=1500000 loops=1)
 Planning Time: 0.065 ms
 Execution Time: 13237.138 ms
(6 rows)

Time: 13237.643 ms (00:13.238)

It can be seen that in terms of quicksort, TiDB’s performance is significantly better than pg.
(Data loading only takes 1.x seconds, so the data reading time is temporarily ignored)
pg takes 13 seconds, 430MB of memory. TiDB only takes 7.3 seconds, 350MB of memory.

2. Single-threaded disk spill sorting, observing efficiency.
From the above test, it can be seen that the copTask in the tikv-client cache size is 128MB, the sorting is all done in memory, using 351MB, and the total memory usage of the statement is about 500MB. To make it spill to disk, modify the memory to 200MB:

set tidb_distsql_scan_concurrency=1;
set tidb_mem_quota_query=209715200;
mysql> explain analyze select * from customer order by C_COMMENT desc, C_ACCTBAL asc;
+-------------------------+------------+---------+-----------+----------------+------------------------------------------------------------------------------------------------------------------------------------------------------------------------------------------------------------------------------------------------------------------------------------------------------+-------------------------------------------------------+----------+----------+
| id                      | estRows    | actRows | task      | access object  | execution info                                                                                                                                                                                                                                                                                       | operator info                                         | memory   | disk     |
+-------------------------+------------+---------+-----------+----------------+------------------------------------------------------------------------------------------------------------------------------------------------------------------------------------------------------------------------------------------------------------------------------------------------------+-------------------------------------------------------+----------+----------+
| Sort_4                  | 1500000.00 | 1500000 | root      |                | time:39.3s, loops:1466                                                                                                                                                                                                                                                                               | tpch.customer.c_comment:desc, tpch.customer.c_acctbal | 144.9 MB | 284.2 MB |
| └─TableReader_8         | 1500000.00 | 1500000 | root      |                | time:1.94s, loops:1471, cop_task: {num: 8, max: 470.8ms, min: 70.3ms, avg: 241.2ms, p95: 470.8ms, max_proc_keys: 297022, p95_proc_keys: 297022, tot_proc: 1.38s, tot_wait: 4ms, rpc_num: 8, rpc_time: 1.93s, copr_cache: disabled, distsql_concurrency: 1}                                           | data:TableFullScan_7                                  | 128.9 MB | N/A      |
|   └─TableFullScan_7     | 1500000.00 | 1500000 | cop[tikv] | table:customer | tikv_task:{proc max:186ms, min:34ms, avg: 112.4ms, p80:174ms, p95:186ms, iters:1502, tasks:8}, scan_detail: {total_process_keys: 1500000, total_process_keys_size: 305225771, total_keys: 1500008, get_snapshot_time: 7.08ms, rocksdb: {key_skipped_count: 1500000, block: {cache_hit_count: 5035}}} | keep order:false                                      | N/A      | N/A      |
+-------------------------+------------+---------+-----------+----------------+------------------------------------------------------------------------------------------------------------------------------------------------------------------------------------------------------------------------------------------------------------------------------------------------------+-------------------------------------------------------+----------+----------+
3 rows in set (39.30 sec)

It can be seen that external sorting takes 39.3 seconds.
The test situation in pg is as follows:
Turn off pg parallelism, set the sort area memory size to 50MB (less than the memory used by TiDB sorting):

tpch=# set work_mem=51200;
tpch=# set max_parallel_workers_per_gather=1;
SET
Time: 0.397 ms
tpch=# explain analyze select * from customer order by C_COMMENT desc, C_ACCTBAL asc;
                                                               QUERY PLAN                                                               
----------------------------------------------------------------------------------------------------------------------------------------
 Gather Merge  (cost=207024.61..308481.63 rows=882235 width=167) (actual time=4737.983..7385.264 rows=1500000 loops=1)
   Workers Planned: 1
   Workers Launched: 1
   ->  Sort  (cost=206024.60..208230.19 rows=882235 width=167) (actual time=4507.940..5643.202 rows=750000 loops=2)
         Sort Key: c_comment DESC, c_acctbal
         Sort Method: external merge  Disk: 143792kB
         Worker 0:  Sort Method: external merge  Disk: 123336kB
         ->  Parallel Seq Scan on customer  (cost=0.00..46527.35 rows=882235 width=167) (actual time=0.008..61.661 rows=750000 loops=2)
 Planning Time: 0.066 ms
 Execution Time: 7468.150 ms
(10 rows)

It can be seen that pg external sorting takes 7.4 seconds, which is nearly twice as fast as full in-memory quicksort.
It can be seen that in terms of external sorting that spills to disk, pg’s performance is significantly better than TiDB.
pg takes 7.5 seconds, TiDB takes 39.3 seconds.
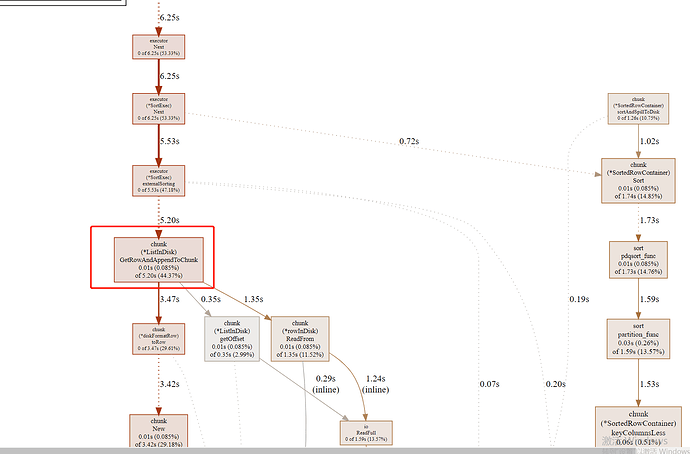
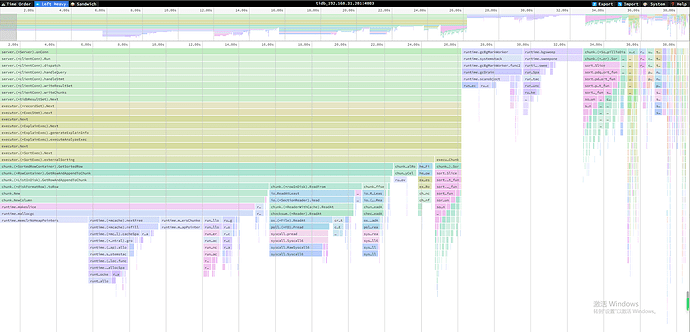
TiDB’s main time consumption is spent on disk wait-related processing:

3. pg multi-threaded disk spill sorting, observing efficiency

# Enable parallelism:
set max_parallel_workers_per_gather=4;
# Set the sort work area to 50MB. (Smaller than the memory available for TiDB's sort operator)
set work_mem=51200;

tpch=# explain analyze select * from customer order by C_COMMENT desc, C_ACCTBAL asc;
                                                               QUERY PLAN                                                               
----------------------------------------------------------------------------------------------------------------------------------------
 Gather Merge  (cost=107926.06..287503.96 rows=1499799 width=167) (actual time=2829.578..6503.408 rows=1500000 loops=1)
   Workers Planned: 4
   Workers Launched: 4
   ->  Sort  (cost=106926.00..107863.38 rows=374950 width=167) (actual time=2618.420..2836.848 rows=300000 loops=5)
         Sort Key: c_comment DESC, c_acctbal
         Sort Method: external merge  Disk: 62128kB
         Worker 0:  Sort Method: external merge  Disk: 79400kB
         Worker 1:  Sort Method: external merge  Disk: 31752kB
         Worker 2:  Sort Method: external merge  Disk: 62128kB
         Worker 3:  Sort Method: external merge  Disk: 31744kB
         ->  Parallel Seq Scan on customer  (cost=0.00..41454.50 rows=374950 width=167) (actual time=0.010..57.328 rows=300000 loops=5)
 Planning Time: 0.148 ms
 Execution Time: 6571.564 ms
(13 rows)

It can be seen that in terms of parallelism, pg’s external sorting does not have much performance improvement (but by observing, the CPU consumption has increased several times).
Overall conclusion: TiDB’s external sorting is several times slower than pg.
Therefore, it is hoped that TiDB’s external sorting can be further optimized, such as making the disk spill behavior asynchronous to reduce the time consumption unrelated to sorting, thereby increasing the overall sorting efficiency.
| username: 人如其名 | Original post link

The biggest time consumption should be when fetching data from the disk, as one IO operation retrieves one column in a row, causing a performance bottleneck. If one chunk is fetched at a time, the efficiency should be much better.

// GetRowAndAppendToChunk gets a Row from the ListInDisk by RowPtr. Return the Row and the Ref Chunk.
func (l *ListInDisk) GetRowAndAppendToChunk(ptr RowPtr, chk *Chunk) (row Row, _ *Chunk, err error) {
	off, err := l.getOffset(ptr.ChkIdx, ptr.RowIdx)
	if err != nil {
		return
	}
	r := l.dataFile.getSectionReader(off)
	format := rowInDisk{numCol: len(l.fieldTypes)}
	_, err = format.ReadFrom(r)
	if err != nil {
		return row, nil, err
	}
	row, chk = format.toRow(l.fieldTypes, chk)
	return row, chk, err
}

// ReadFrom reads data of r, deserializes it from the format of diskFormatRow
// into Row.
func (row *rowInDisk) ReadFrom(r io.Reader) (n int64, err error) {
	b := make([]byte, 8*row.numCol)
	var n1 int
	n1, err = io.ReadFull(r, b)
	n += int64(n1)
	if err != nil {
		return
	}
	row.sizesOfColumns = bytesToI64Slice(b)
	row.cells = make([][]byte, 0, row.numCol)
	for _, size := range row.sizesOfColumns {
		if size == -1 {
			continue
		}
		cell := make([]byte, size)
		row.cells = append(row.cells, cell)
		n1, err = io.ReadFull(r, cell)
		n += int64(n1)
		if err != nil {
			return
		}
	}
	return
}
| username: h5n1 | Original post link

:call_me_hand::call_me_hand::call_me_hand::call_me_hand::call_me_hand::call_me_hand:

| username: 裤衩儿飞上天 | Original post link

:call_me_hand::call_me_hand::call_me_hand::call_me_hand::call_me_hand::call_me_hand::call_me_hand::call_me_hand::call_me_hand::call_me_hand::call_me_hand:

| username: wisdom | Original post link

Awesome! Awesome! Awesome!

| username: 人如其名 | Original post link

The analysis here is incorrect because although rowInDisk.ReadFrom fetches one column at a time, TiDB still implements a layer of caching (ReaderWithCache) underneath. Therefore, the issue is not due to the small IO operations analyzed here. The problem should lie in the lower-level mechanism (IO issue).

| username: 近墨者zyl | Original post link

Awesome, I’ve learned a lot.

| username: 人如其名 | Original post link

Don’t praise me, guys. This is not a share, just a feature enhancement request.

| username: 人如其名 | Original post link

The official documentation shows that the disk read has been optimized: TiDB 7.1.1 Release Notes | PingCAP 文档中心

Corresponding ISSUE: Implement a fast row container reader to dump rows from disk · Issue #45125 · pingcap/tidb · GitHub

However, with the same data volume in version 7.1.1, the execution efficiency is still very low after writing to disk.


mysql> set tidb_distsql_scan_concurrency=1;
Query OK, 0 rows affected (0.00 sec)

mysql> set tidb_mem_quota_query=209715200;
Query OK, 0 rows affected (0.00 sec)

mysql> explain analyze select * from customer order by C_COMMENT desc, C_ACCTBAL asc;
+-------------------------+------------+---------+-----------+----------------+-------------------------------------------------------------------------------------------------------------------------------------------------------------------------------------------------------------------------------------------------------------------------------------------------------------------------------+-----------------------------------------------------------+----------+----------+
| id                      | estRows    | actRows | task      | access object  | execution info                                                                                                                                                                                                                                                                                                                | operator info                                             | memory   | disk     |
+-------------------------+------------+---------+-----------+----------------+-------------------------------------------------------------------------------------------------------------------------------------------------------------------------------------------------------------------------------------------------------------------------------------------------------------------------------+-----------------------------------------------------------+----------+----------+
| Sort_4                  | 1500000.00 | 1500000 | root      |                | time:34.6s, loops:1466, RU:5061.368437                                                                                                                                                                                                                                                                                        | tpch10.customer.c_comment:desc, tpch10.customer.c_acctbal | 189.3 MB | 204.9 MB |
| └─TableReader_8         | 1500000.00 | 1500000 | root      |                | time:1.52s, loops:1468, cop_task: {num: 54, max: 74.9ms, min: 817µs, avg: 29.1ms, p95: 63.2ms, max_proc_keys: 50144, p95_proc_keys: 50144, tot_proc: 1.17s, tot_wait: 8.07ms, rpc_num: 54, rpc_time: 1.57s, copr_cache_hit_ratio: 0.00, build_task_duration: 13.6µs, max_distsql_concurrency: 1}                              | data:TableFullScan_7                                      | 22.5 MB  | N/A      |
|   └─TableFullScan_7     | 1500000.00 | 1500000 | cop[tikv] | table:customer | tikv_task:{proc max:39ms, min:0s, avg: 13.1ms, p80:23ms, p95:32ms, iters:1678, tasks:54}, scan_detail: {total_process_keys: 1500000, total_process_keys_size: 305225771, total_keys: 1500054, get_snapshot_time: 1.24ms, rocksdb: {delete_skipped_count: 217344, key_skipped_count: 1717344, block: {cache_hit_count: 7743}}} | keep order:false                                          | N/A      | N/A      |
+-------------------------+------------+---------+-----------+----------------+-------------------------------------------------------------------------------------------------------------------------------------------------------------------------------------------------------------------------------------------------------------------------------------------------------------------------------+-----------------------------------------------------------+----------+----------+
3 rows in set (34.58 sec)

mysql> select version();
+--------------------+
| version()          |
+--------------------+
| 5.7.25-TiDB-v7.1.1 |
+--------------------+
1 row in set (0.00 sec)

Looking at pprof, it seems to be a GC issue:

(pprof) top
Showing nodes accounting for 5780ms, 60.97% of 9480ms total
Dropped 256 nodes (cum <= 47.40ms)
Showing top 10 nodes out of 141
      flat  flat%   sum%        cum   cum%
    2400ms 25.32% 25.32%     2400ms 25.32%  runtime.memclrNoHeapPointers
    1210ms 12.76% 38.08%     1210ms 12.76%  runtime/internal/syscall.Syscall6
     490ms  5.17% 43.25%      490ms  5.17%  runtime.(*fixalloc).alloc
     430ms  4.54% 47.78%      940ms  9.92%  runtime.sweepone
     260ms  2.74% 50.53%      280ms  2.95%  runtime.findObject
     260ms  2.74% 53.27%     4880ms 51.48%  runtime.mallocgc
     210ms  2.22% 55.49%      800ms  8.44%  runtime.scanobject
     180ms  1.90% 57.38%      200ms  2.11%  runtime.writeHeapBits.flush
     170ms  1.79% 59.18%      170ms  1.79%  hash/crc32.ieeeCLMUL
     170ms  1.79% 60.97%      170ms  1.79%  runtime.futex
(pprof) tree
Showing nodes accounting for 8.33s, 87.87% of 9.48s total
Dropped 256 nodes (cum <= 0.05s)
Showing top 80 nodes out of 141
----------------------------------------------------------+-------------
      flat  flat%   sum%        cum   cum%   calls calls% + context              
----------------------------------------------------------+-------------
                                             2.40s   100% |   runtime.mallocgc
     2.40s 25.32% 25.32%      2.40s 25.32%                | runtime.memclrNoHeapPointers
----------------------------------------------------------+-------------
                                             1.18s 97.52% |   syscall.RawSyscall6
     1.21s 12.76% 38.08%      1.21s 12.76%                | runtime/internal/syscall.Syscall6
----------------------------------------------------------+-------------
                                             0.46s 93.88% |   runtime.(*mheap).allocSpan
                                             0.03s  6.12% |   runtime.systemstack
     0.49s  5.17% 43.25%      0.49s  5.17%                | runtime.(*fixalloc).alloc
----------------------------------------------------------+-------------
                                             0.94s   100% |   runtime.bgsweep
     0.43s  4.54% 47.78%      0.94s  9.92%                | runtime.sweepone
                                             0.41s 43.62% |   runtime.(*sweepLocked).sweep
                                             0.03s  3.19% |   runtime.(*spanSet).pop
                                             0.03s  3.19% |   runtime.(*sweepLocker).tryAcquire
----------------------------------------------------------+-------------
                                             0.28s   100% |   runtime.scanobject
     0.26s  2.74% 50.53%      0.28s  2.95%                | runtime.findObject
----------------------------------------------------------+-------------
                                             4.54s 93.03% |   runtime.makeslice
                                             0.27s  5.53% |   runtime.newobject
                                             0.07s  1.43% |   github.com/pingcap/tidb/util/checksum.(*Reader).ReadAt
     0.26s  2.74% 53.27%      4.88s 51.48%                | runtime.mallocgc
                                             2.40s 49.18% |   runtime.memclrNoHeapPointers
                                             1.19s 24.39% |   runtime.(*mcache).nextFree
                                             0.43s  8.81% |   runtime.mProf_Malloc
                                             0.28s  5.74% |   runtime.(*mcache).allocLarge
                                             0.10s  2.05% |   runtime.heapBitsSetType
                                             0.10s  2.05% |   runtime.nextFreeFast (inline)
                                             0.03s  0.61% |   runtime.systemstack
----------------------------------------------------------+-------------
                                             0.79s 98.75% |   runtime.gcDrain
                                             0.01s  1.25% |   runtime.systemstack
     0.21s  2.22% 55.49%      0.80s  8.44%                | runtime.scanobject
                                             0.28s 35.00% |   runtime.findObject
                                             0.19s 23.75% |   runtime.greyobject
                                             0.08s 10.00% |   runtime.heapBitsForAddr
----------------------------------------------------------+-------------
                                             0.11s 55.00% |   runtime.(*mcentral).cacheSpan
                                             0.06s 30.00% |   runtime.(*mcache).allocLarge
                                             0.03s 15.00% |   runtime.heapBitsSetType
     0.18s  1.90% 57.38%      0.20s  2.11%                | runtime.writeHeapBits.flush
----------------------------------------------------------+-------------
                                             0.17s   100% |   hash/crc32.archUpdateIEEE
     0.17s  1.79% 59.18%      0.17s  1.79%                | hash/crc32.ieeeCLMUL
----------------------------------------------------------+-------------
                                             0.11s 64.71% |   runtime.unlock2
                                             0.04s 23.53% |   runtime.systemstack
     0.17s  1.79% 60.97%      0.17s  1.79%                | runtime.futex
----------------------------------------------------------+-------------
                                             0.12s 92.31% |   github.com/pingcap/tidb/util/chunk.appendCellByCell
                                             0.01s  7.69% |   github.com/pingcap/tidb/util/checksum.(*Reader).ReadAt
     0.13s  1.37% 62.34%      0.13s  1.37%                | runtime.memmove
----------------------------------------------------------+-------------
                                             0.05s 41.67% |   runtime.(*consistentHeapStats).acquire (inline)
                                             0.05s 41.67% |   runtime.(*consistentHeapStats).release (inline)
                                             0.02s 16.67% |   runtime.(*spanSet).pop (inline)
     0.12s  1.27% 63.61%      0.12s  1.27%                | runtime/internal/atomic.(*Uint32).Add
----------------------------------------------------------+-------------
                                             0.10s   100% |   runtime.mallocgc (inline)
     0.10s  1.05% 64.66%      0.10s  1.05%                | runtime.nextFreeFast
----------------------------------------------------------+-------------
                                             0.15s 57.69% |   runtime.pcdatavalue
                                             0.11s 42.31% |   runtime.gentraceback
     0.10s  1.05% 65.72%      0.26s  2.74%                | runtime.pcvalue
                                             0.12s 46.15% |   runtime.step
----------------------------------------------------------+-------------
                                             0.12s   100% |   runtime.pcvalue
     0.10s  1.05% 66.77%      0.12s  1.27%                | runtime.step
----------------------------------------------------------+-------------
                                             0.07s 87.50% |   runtime.(*mheap).freeSpanLocked
                                             0.01s 12.50% |   runtime.(*mheap).allocSpan
     0.08s  0.84% 67.83%      0.08s  0.84%                | runtime.(*pallocBits).summarize
----------------------------------------------------------+-------------
                                             0.07s   100% |   github.com/pingcap/tidb/types.CompareString (inline)
     0.07s  0.74% 68.57%      0.07s  0.74%                | github.com/pingcap/tidb/util/collate.truncateTailingSpace
----------------------------------------------------------+-------------
                                             0.09s   100% |   runtime.(*mcache).refill
     0.07s  0.74% 69.31%      0.09s  0.95%                | runtime.(*spanSet).push
----------------------------------------------------------+-------------
                                             0.04s 57.14% |   runtime.(*mcentral).cacheSpan
                                             0.03s 42.86% |   runtime.sweepone
     0.07s  0.74% 70.05%      0.07s  0.74%                | runtime.(*sweepLocker).tryAcquire
----------------------------------------------------------+-------------
                                             0.08s   100% |   runtime.scanobject
     0.07s  0.74% 70.79%      0.08s  0.84%                | runtime.heapBitsForAddr
----------------------------------------------------------+-------------
                                             0.07s 87.50% |   runtime.greyobject (inline)
                                             0.01s 12.50% |   runtime.(*mheap).freeSpanLocked (inline)
     0.07s  0.74% 71.53%      0.08s  0.84%                | runtime.pageIndexOf
----------------------------------------------------------+-------------
                                             0.06s   100% |   runtime.(*mcache).refill (inline)
     0.06s  0.63% 72.16%      0.06s  0.63%                | runtime.(*mcentral).partialSwept
----------------------------------------------------------+-------------
                                             0.06s   100% |   runtime.(*mheap).initSpan
     0.06s  0.63% 72.79%      0.06s  0.63%                | runtime.(*mspan).init
----------------------------------------------------------+-------------
                                             0.19s   100% |   runtime.scanobject
     0.06s  0.63% 73.42%      0.19s  2.00%                | runtime.greyobject
                                             0.07s 36.84% |   runtime.pageIndexOf (inline)
                                             0.05s 26.32% |   runtime.(*gcWork).putFast (inline)
----------------------------------------------------------+-------------
                                             1.92s   100% |   io.(*SectionReader).Read
     0.05s  0.53% 73.95%      1.92s 20.25%                | github.com/pingcap/tidb/util/checksum.(*Reader).ReadAt
                                             1.49s 77.60% |   os.(*File).ReadAt
                                             0.26s 13.54% |   hash/crc32.update
                                             0.07s  3.65% |   runtime.mallocgc
                                             0.01s  0.52% |   runtime.memmove
----------------------------------------------------------+-------------
                                             0.05s   100% |   hash/crc32.archUpdateIEEE (inline)
     0.05s  0.53% 74.48%      0.05s  0.53%                | hash/crc32.simpleUpdate
----------------------------------------------------------+-------------
                                             0.05s   100% |   runtime.greyobject (inline)
     0.05s  0.53% 75.01%      0.05s  0.53%                | runtime.(*gcWork).putFast
----------------------------------------------------------+-------------
                                             1.15s   100% |   runtime.(*mcache).nextFree
     0.05s  0.53% 75.54%      1.15s 12.13%                | runtime.(*mcache).refill
                                             0.87s 75.65% |   runtime.(*mcentral).cacheSpan
                                             0.09s  7.83% |   runtime.(*spanSet).push
                                             0.06s  5.22% |   runtime.(*mcentral).partialSwept (inline)
                                             0.03s  2.61% |   runtime.(*consistentHeapStats).release
                                             0.01s  0.87% |   runtime.(*consistentHeapStats).acquire
----------------------------------------------------------+-------------
                                             0.21s   100% |   runtime.systemstack
     0.05s  0.53% 76.07%      0.21s  2.22%                | runtime.(*mheap).freeSpanLocked
                                             0.07s 33.33% |   runtime.(*pallocBits).summarize
                                             0.02s  9.52% |   runtime.(*consistentHeapStats).acquire
                                             0.02s  9.52% |   runtime.(*consistentHeapStats).release
                                             0.01s  4.76% |   runtime.pageIndexOf (inline)
| username: redgame | Original post link

:call_me_hand::call_me_hand::call_me_hand:

| username: YangKeao | Original post link

In version 7.1.1, the optimization for disk writes only improved the GetChunk function (which is used when reading data continuously). The Sort operator’s disk writes indeed won’t see a significant improvement because Sort writes to disk randomly and does not use GetChunk for reading.

However, there is indeed a lot of room for optimization in the Chunk allocation within SortExec. There is a PR attempting to optimize it: executor: pre-alloc chunks to optimize `SortExec` in by YangKeao · Pull Request #46483 · pingcap/tidb · GitHub :saluting_face:

| username: cassblanca | Original post link

:+1: :+1: You can directly submit the optimized code.

| username: 人如其名 | Original post link

Can this be optimized together with the disk spill of hashagg? After hashagg spills to disk, it is also slow and the space amplification is very obvious. Refer to this post: 对于hashAgg算子非并行模式下还是发生OOM - TiDB 的问答社区. One of the issues is: 3. For issue 3, multiple disk spill operations not only amplify issue 1 but also cause a sharp increase in disk space usage. Can it be designed into multiple “segments” to promptly reclaim unused space?

Please consider the disk spill behavior of multiple operators comprehensively. Try to reuse objects (to avoid excessive GC) and make each read/write IO as efficient as possible (one or more chunks, I think the case of large fields should also be considered to avoid excessive memory usage by a single IO). After data spills to disk, it should be as compact as possible (to avoid wasting space) to design a unified disk spill mechanism. Thank you very much!

| username: YangKeao | Original post link

I haven’t really considered the issue of multiple disk writes causing space amplification :man_facepalming:. Learned something new.

However, at least in terms of efficiency, this optimization in version 7.1.1 should already have some effect on HashAgg. We’ve already observed a noticeable performance improvement in HashAgg disk writes in some of our own workloads: specifically, HashAgg has become over 30% faster (this number only represents the results of specific queries running in specific environments).

| username: 人如其名 | Original post link

Got it, thank you. I did a simple test, and in cases of low redundancy and minimal disk writes, the efficiency has more than doubled, as follows:
tpch100, select c_phone, count() from customer group by c_phone order by count() desc limit 10;
Version 6.5.0:
Disk writes: 700MB, total time: 2m56s.
Version 6.5.4:
Disk writes: 700MB, total time: 1m12s.
In cases of larger data volume disk writes, I estimate the improvement will be even more significant. This represents a considerable enhancement in the disk write efficiency of hashAGG. :pray:

| username: 人如其名 | Original post link

I’ll close the thread once the efficiency improvement for sort to disk is released. :smiley:

| username: 人如其名 | Original post link

This PR has already implemented parallel write capabilities: executor: Support parallel sort spill by xzhangxian1008 · Pull Request #50747 · pingcap/tidb · GitHub

| username: YuchongXU | Original post link

Mark.

| username: TiDBer_RjzUpGDL | Original post link

Support.