Note:
This topic has been translated from a Chinese forum by GPT and might contain errors.Original topic: 资源管控监控图只能看到default组,无法看到其他资源组的情况
[TiDB Usage Environment] Testing/
[TiDB Version] 7.1.0
[Reproduction Path] What operations were performed to encounter the issue
[Encountered Issue: Problem Phenomenon and Impact]
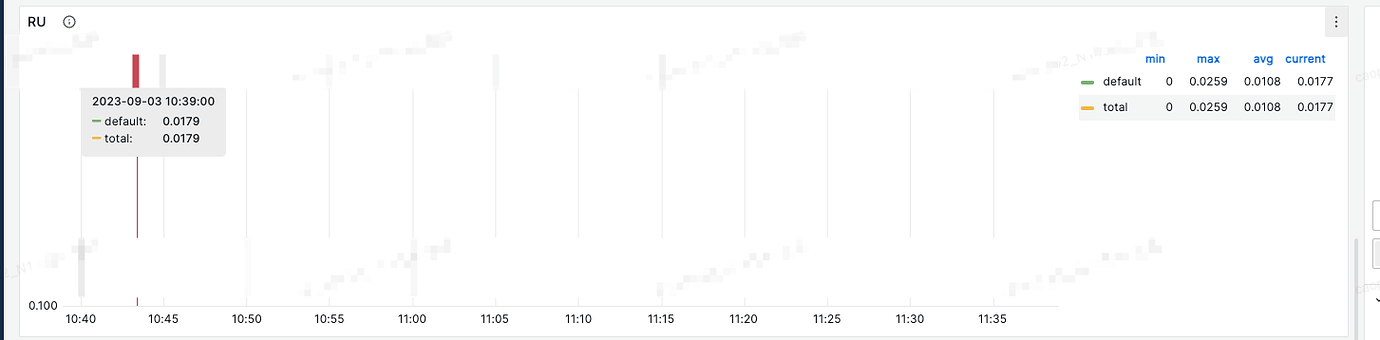
Using the Grafana template from the official repo: https://github.com/pingcap/tidb/blob/master/metrics/grafana/tidb_resource_control.json, taking the “RU” monitoring chart as an example, only the default group and total usage can be seen, and the situation of other resource groups cannot be seen. The promSQL is sum(rate(resource_manager_resource_unit_read_request_unit_sum{cluster="$tidb_cluster"}[1m])) by (name) + sum(rate(resource_manager_resource_unit_write_request_unit_sum{cluster="$tidb_cluster"}[1m])) by (name)
-
Monitoring Chart
-
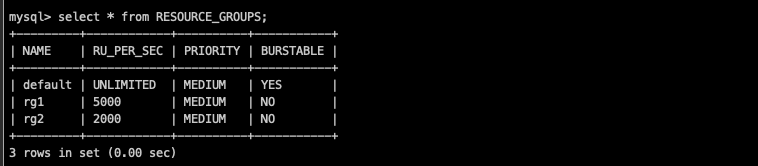
Actual Resource Groups
[Resource Configuration] Go to TiDB Dashboard - Cluster Info - Hosts and take a screenshot of this page
[Attachments: Screenshots/Logs/Monitoring]