The same execution plan causes a small number of Coprocessor requests to be excessive, leading to some SQL timeouts

Note:
This topic has been translated from a Chinese forum by GPT and might contain errors.

Original topic: 同一个执行计划 少部分Coprocessor 请求数量偏大 导致部分sql超时

| username: ojsl

To improve efficiency, please provide the following information. A clear problem description will help resolve the issue faster:

【TiDB Usage Environment】
AWS EC2 deployment using TiUP

【Overview】 Scenario + Problem Overview
Low data resource utilization, not a hardware resource bottleneck

【Background】 Actions taken

【Phenomenon】 Business and database phenomena
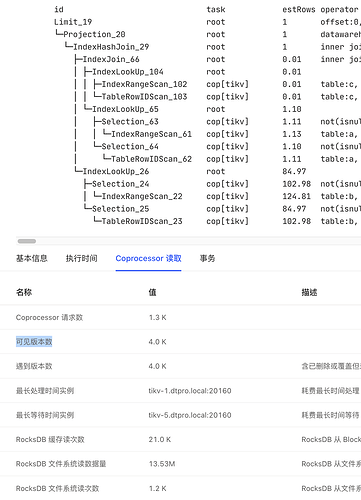
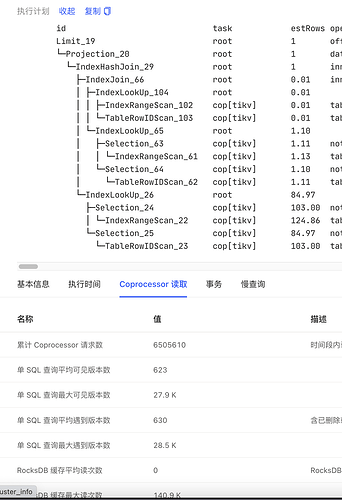
There is a highly concurrent SQL query with an average query time of around 50ms, but a small portion of queries take more than 1 second. Comparing slow queries with average queries, the execution plan is consistent, but the number of Coprocessor requests and visible versions for slow queries is a hundred times higher than the average.

【Problem】 Current issue encountered
SQL timeout

【Business Impact】
Causes some SQL queries to time out in the business system.

【TiDB Version】
5.2.1

【Application Software and Version】
Spring Boot

【Attachments】 Relevant logs and configuration information


  • TiUP Cluster Display information
  • TiUP Cluster Edit config information

Monitoring (https://metricstool.pingcap.com/)

  • TiDB-Overview Grafana monitoring
  • TiDB Grafana monitoring
  • TiKV Grafana monitoring
  • PD Grafana monitoring
  • Corresponding module logs (including logs 1 hour before and after the issue)

For questions related to performance optimization or troubleshooting, please download and run the script. Please select all and copy-paste the terminal output results for upload.
| username: h5n1 | Original post link

The data range scanned by different conditions is different, and this data range has a large number of historical versions that have not been cleaned up. Additionally, your second graph shows cumulative values.

| username: ojsl | Original post link

The data corresponding to this query changes slowly, with no large-scale data modifications, but the number of visible versions for slow queries is also much higher than the average.

| username: h5n1 | Original post link

It could be a bug, refer to

| username: ojsl | Original post link

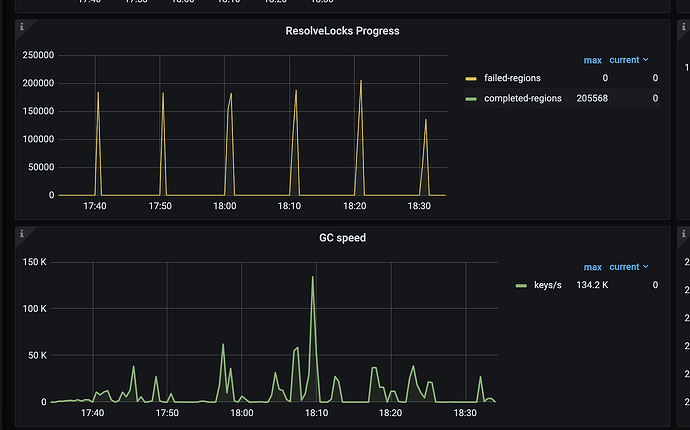
Verified that the relevant data matches this bug, the configuration has been modified, and the GC CPU has increased.

| username: forever | Original post link

Bro, do you think the official team will implement a feature similar to pg vacuum? :smiley:

| username: ojsl | Original post link

Which requirement needs to use vacuum?

| username: forever | Original post link

When encountering a bug with GC and historical data cannot be deleted, you can manually execute a command, or perhaps perform an operation like a backup first to see if it works better.

| username: ojsl | Original post link

There is a dedicated GC thread working, but there is currently a version bug that prevents it from correctly returning the content that needs to be GC’d.

| username: ojsl | Original post link

After adjusting the GC parameters for 2 days, the GC speed has significantly decreased, but the key_skipped_count in the explain analyze table statistics has not reduced. Is this normal?

| username: ojsl | Original post link

We checked a version 5.4 cluster and found that performing an explain analyze table on one of the tables resulted in total_process_keys: 110686744 and key_skipped_count: 276305791. However, we observed that the GC monitoring is working. We have adjusted the parameters of the version 5.2 cluster for a week, but the key_skipped_count obtained from explain analyze table has not decreased.