Note:
This topic has been translated from a Chinese forum by GPT and might contain errors.
Original topic: 同一条SQL,在同一个TiDB Server实例上执行,前后执行结果不一样
[TiDB Usage Environment] Production Environment
[TiDB Version] v5.3.0
[Reproduction Path] Client Language: Go, Initiate Program, Execute the following SQL at intervals, the amount of data returned before and after is inconsistent.
SELECT `order_id`, `agent_tx_no`, `paid_amount`, `pay_time`, `recon_time`
FROM `pay_order`
WHERE pay_time > '1718899199'
AND pay_time < '1718985600'
AND status = '3'
AND channel_id IN ('9','31','122','126','132','136','179','180','181','182','183','186','118','119','229')
ORDER BY id desc;
[Encountered Problem: Phenomenon and Impact]
[Resource Configuration] Go to TiDB Dashboard - Cluster Info - Hosts and take a screenshot of this page
[Attachments: Screenshots/Logs/Monitoring]
-
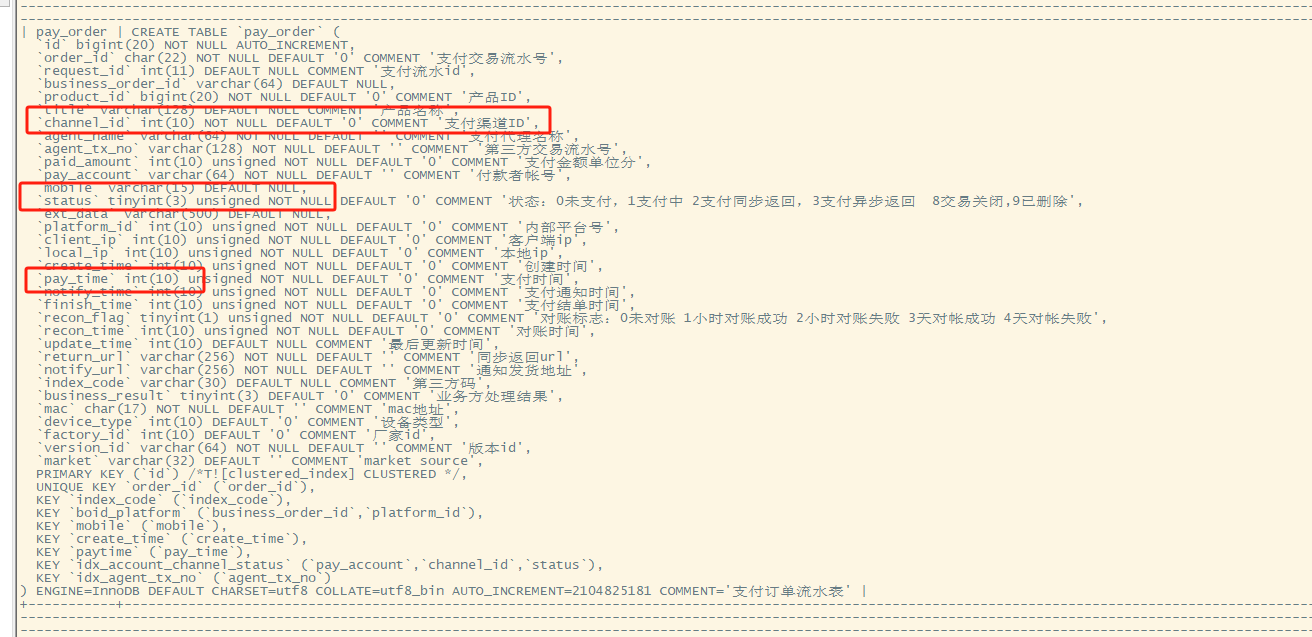
Table Structure
-
Program Run Logs, Slow Logs:
-
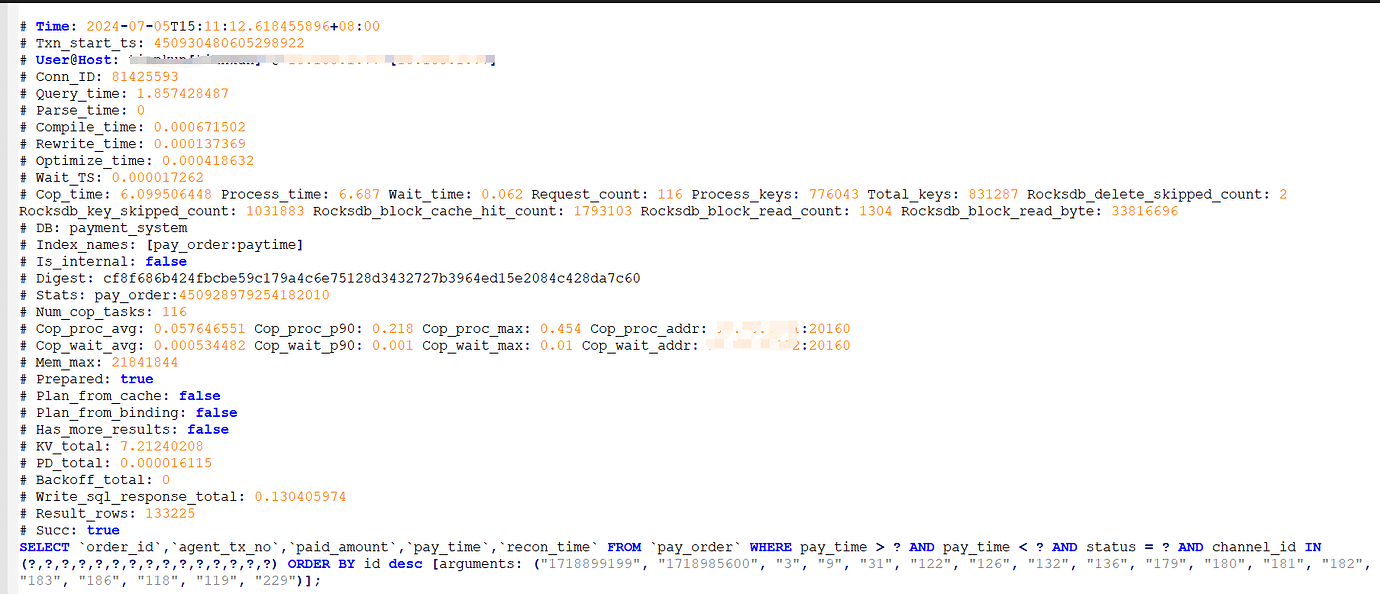
Correct Data Amount is 133225
-
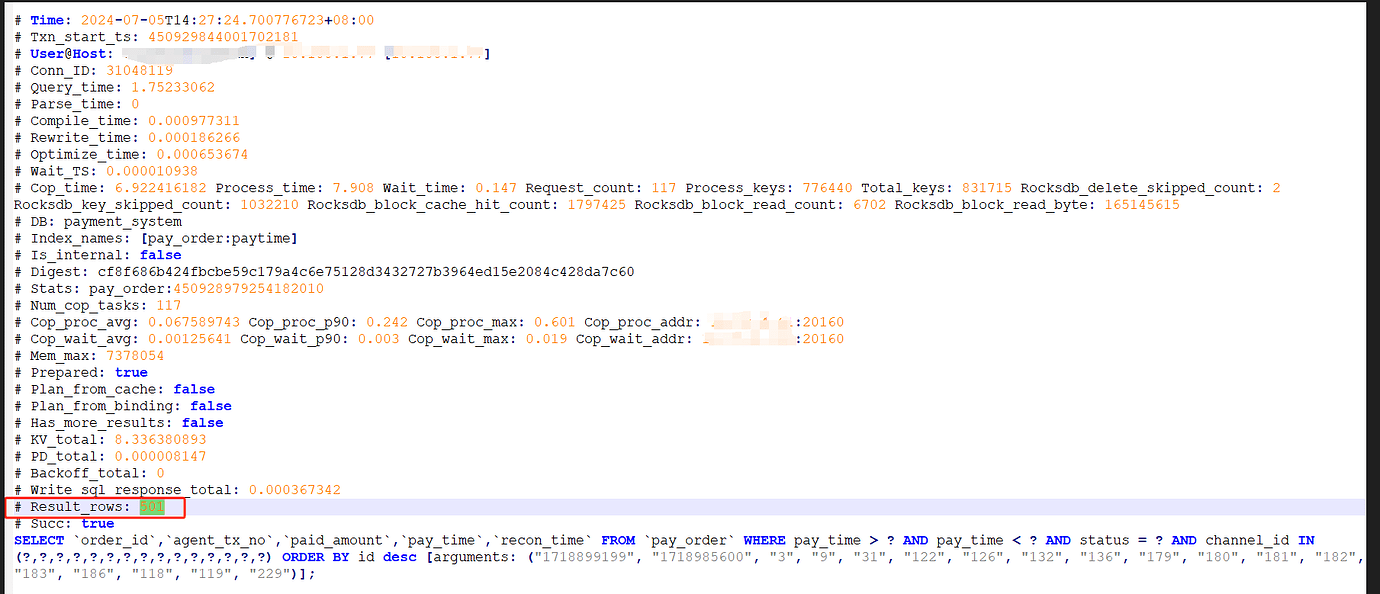
Incorrect Data Amount is 501
-
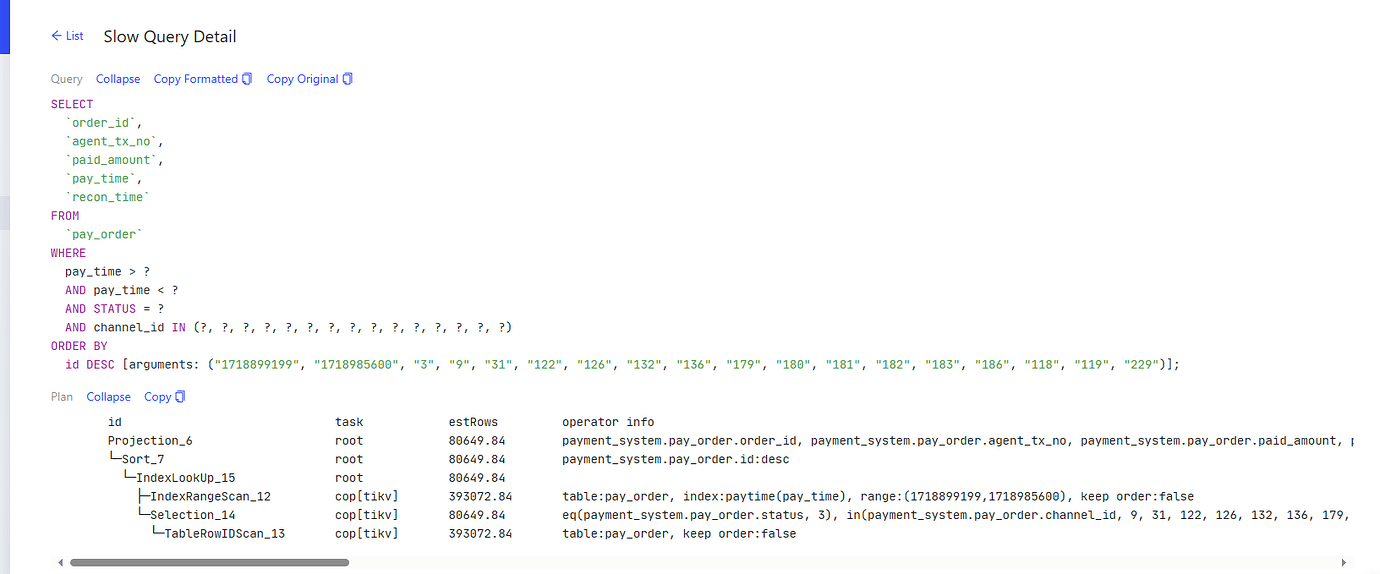
Execution Plan: The execution plan uses the TiKV node, paytime (pay_time) index, and implicit conversion has been ruled out.
Can it still be reproduced? Could you provide the execution plan text format for both the incorrect and correct results?
It looks like there is an issue with the execution plan:
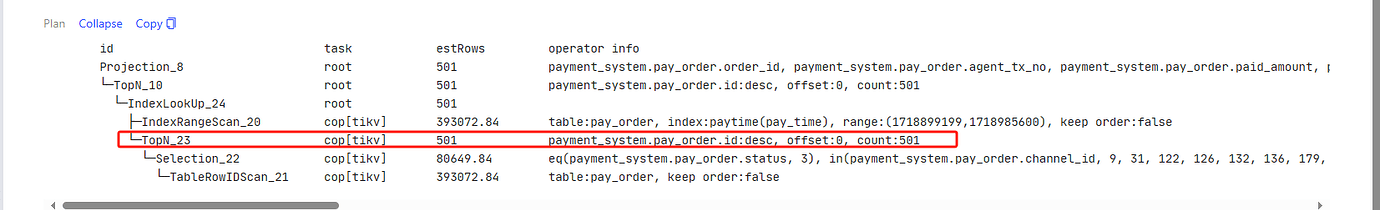
Incorrect execution plan:
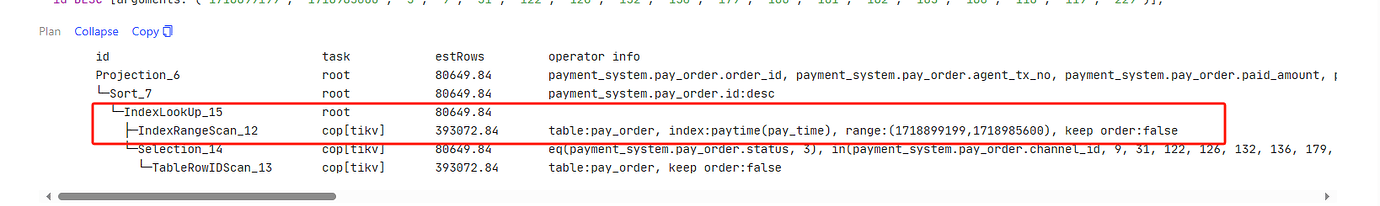
Correct execution plan:
The incorrect execution plan, why does it use TopN calculation, returning only one row of data from each TiKV Region to TiDB? Wouldn’t that result in data loss?
I don’t know where the TOP N comes from  , take the plan_digest from the execution plan in the dashboard and check the slow query to see if it’s there. If it is, post the information from the slow query.
All the slow queries are the same:
SELECT `order_id`, `agent_tx_no`, `paid_amount`, `pay_time`, `recon_time`
FROM `pay_order`
WHERE pay_time > ? AND pay_time < ? AND status = ? AND channel_id IN (?,?,?,?,?,?,?,?,?,?,?,?,?,?,?)
ORDER BY id desc
[arguments: ("1718899199", "1718985600", "3", "9", "31", "122", "126", "132", "136", "179", "180", "181", "182", "183", "186", "118", "119", "229")];
slow_query.sql (3.2 KB)
Go check the dashboard to see if there is any possibility that the application executed any sql_select_limit related statements. I really don’t know anything else.
Before checking, you can look at the completeness of the records in the statement summary table. Refer to: Statement Summary Tables | PingCAP 文档中心
If it is not complete, you can temporarily increase it, then wait for a period of time to reproduce the issue and check again.
The application might not be reliable. In case there are other parameters passed within the framework, you should execute the same SQL in the database window to check.
I suggest you use ADMIN CHECK TABLE pay_order; to verify if the main table and the index are inconsistent.
The sql_select_limit statement has not been executed. The complete SQL executed in the program will be printed, and the digest of both abnormal and normal SQL is the same.
The same SQL is executed repeatedly, and the correct number of rows is returned each time.
Will executing the check operation on the pay_order table with around 2 billion rows lock the table and consume a large amount of IO and CPU resources?
How do you confirm that the sql_select_limit statement has not been executed?
This should not be a data index inconsistency issue. Look at his execution plan; it uses the same index.
I couldn’t find a similar bug on GitHub (of course, it could be due to incorrect search keywords). Now I suspect that the sql_select_limit might be too large. I suggest enabling audit logs or general logs, or setting the slow SQL threshold to 0. Once it reproduces, analyze all the SQL statements from that session after connecting.
After switching the application to query the native MySQL pay_order table (the upstream synchronized by TiDB), the issue of different result sets did not occur.
As for application logs, I don’t recognize them anyway  . I suggest using the method mentioned above to capture the logs (be mindful of the impact on the business). Your scenario seems simple, just one SQL result is different. If you can provide a demo that can consistently reproduce this issue, you can directly open an issue on GitHub.