Note:
This topic has been translated from a Chinese forum by GPT and might contain errors.
Original topic: 同一种sql类型走不同执行计划,很奇怪
[TiDB Usage Environment] Production Environment
[TiDB Version]
4013
[Reproduction Path] What operations were performed when the issue occurred
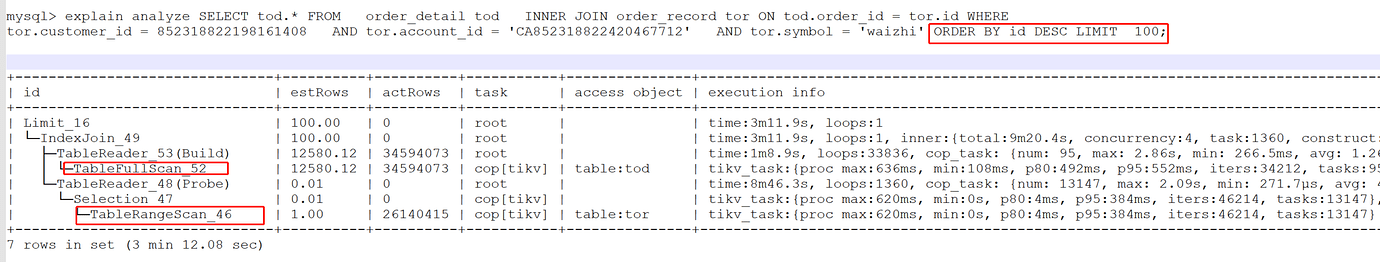
Adding ORDER BY id DESC LIMIT 100; this sorting execution plan turns into a full table scan, not using the index anymore
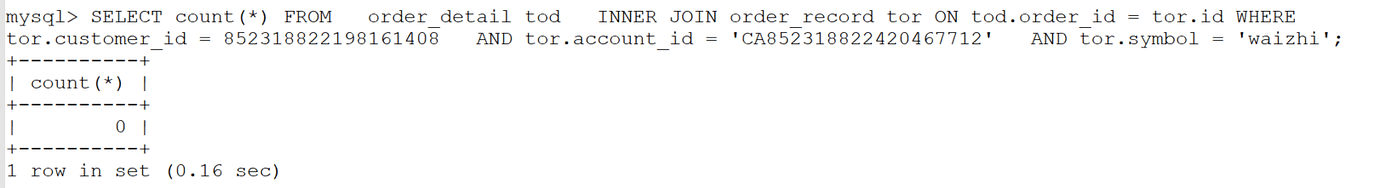
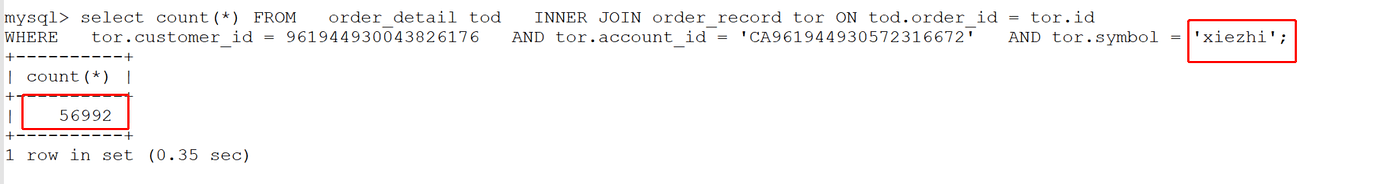
However, if count(*) is not 0, then everything is normal.
Adding ORDER BY id DESC LIMIT 100; is also normal.
It might be caused by where, order by, or limit. Sometimes order by + limit can change the execution order of the original SQL. When the proportion of limit is very small, it may choose to order by first and then evaluate where. The optimizer should compare the size of the limit with the result set size obtained by querying the index file using where to decide whether to scan the table or use the index. You can use the force index statement to specify the index you want to use, or you can change order by id to order by id + 0.
The only difference is that one can retrieve data, while the other cannot.
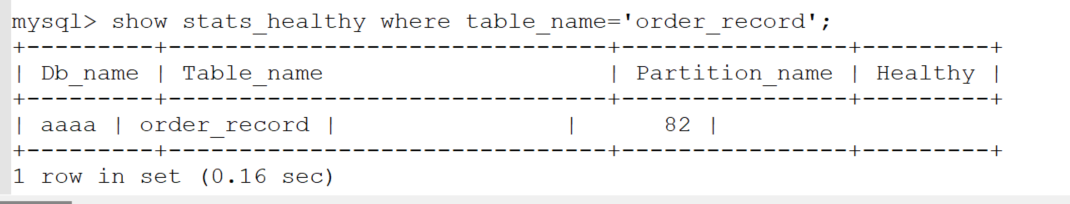
Moreover, the statistical information was not invalid at that time.
This SQL has only run a dozen times, and everything else is normal. However, this type of SQL runs thousands of times in half an hour, with a very high execution frequency.
It seems to be a bug.
You can refer to the following documentation to save two sets of execution site information, one normal and one abnormal. Then, go to GitHub and open an issue.
Take a guess, try swapping the order of tor and tod in the SQL.
TiDB introduced the PLAN REPLAYER command in v5.3.0, which is a bit awkward.
It’s impossible to change the SQL, as this is a core SQL. The one that follows the wrong execution plan was executed a dozen times just yesterday.
You need to manually test it. As a temporary solution, you can use SPM to bind the correct execution plan.
It should not be a bug. I tested it in the test environment, and count(*) is 0. The execution plan is normal.
Could it be an issue with analyze? Try deleting and re-analyzing it?
It’s too risky to do this in production. The SQL is normal now, and this situation occurred for the first time yesterday.
I suspect that the optimizer estimates the costs of both options to be similar.
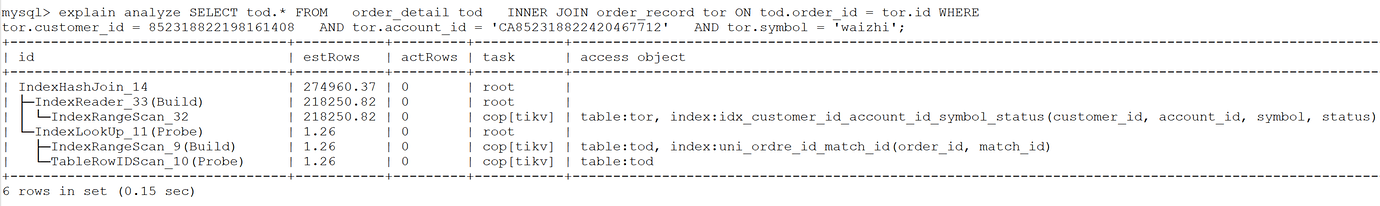
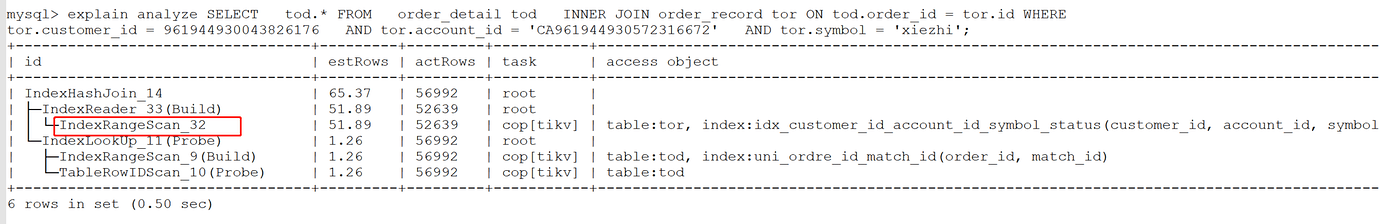
When there is no “ORDER BY”: The optimizer determines that using the index is optimal.
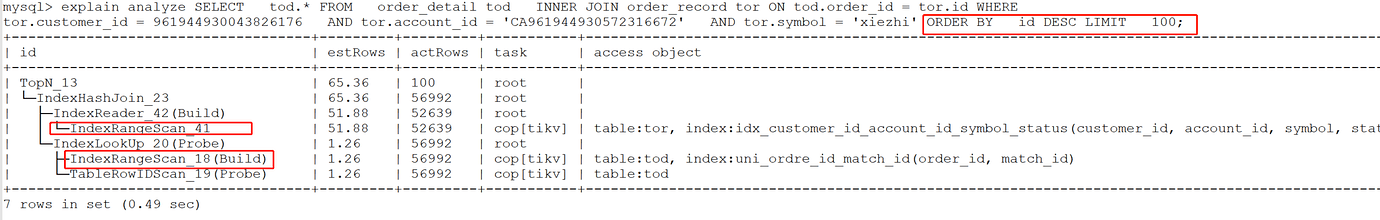
When “ORDER BY LIMIT 100” is added: The optimizer has two choices. The first is to proceed as before, then use a Top operator to sort and take the first 100 rows. The second is that it notices you are ordering by the “id” of the “tod” table, which can take advantage of the primary key’s order (assuming the “tod” table is a clustered table and “keep order” is true when scanning the whole table, though the screenshot is missing, the original poster can confirm this). With this optimization and the limit, it doesn’t need to scan the whole table; it just needs to scan and fetch results until it reaches 100 rows and then stop. However, during actual execution, it finds that it has scanned a lot of data from the “tod” table without finding any matches. After scanning the entire table, it still finds none. The optimizer evaluates both options as similar, so it’s still an issue with the optimizer model (though not necessarily a problem, as the optimizer is based on statistical estimates and can sometimes be inaccurate). To ensure it always uses the index, you can add a more selective condition to the “tor” table for testing.
Could you please check if the production environment and the test environment have the same version, and if the method of collecting statistical information is the same?
The first execution plan, for the tor table, after filtering the tor.customer_id, tor.account_id, and tor.symbol fields, the optimizer estimated the number of records to be 218250.82, but the actual execution resulted in 0 records! This also led to the optimizer mistakenly thinking that the result set was larger in the second execution plan, choosing to use the clustered index primary key id of the tod table to avoid sorting, and associating the tor table to quickly return results. However, in reality, the tor table that meets the conditions will not reach 100 records, because the actual result that meets the conditions is 0. Therefore, all tod table data was requested, and the index association with the tor table caused the execution time to be too long.
Here, the optimizer’s estimated result based on statistical information is seriously inconsistent with the actual result. Either the statistical information is too old, the Count-Min Sketch hash collision is too severe, or there is a problem with the evaluation of the combined filtering factor of multiple fields.
It is recommended to first collect statistical information, and using hints is the best choice.
This topic was automatically closed 60 days after the last reply. New replies are no longer allowed.