Note:
This topic has been translated from a Chinese forum by GPT and might contain errors.
Original topic: 一样的sql,limit不同执行计划就不一样了
[TiDB Usage Environment] Production environment 4013
[Reproduction Path] What operations were performed to encounter the problem
[Encountered Problem: Problem Phenomenon and Impact]
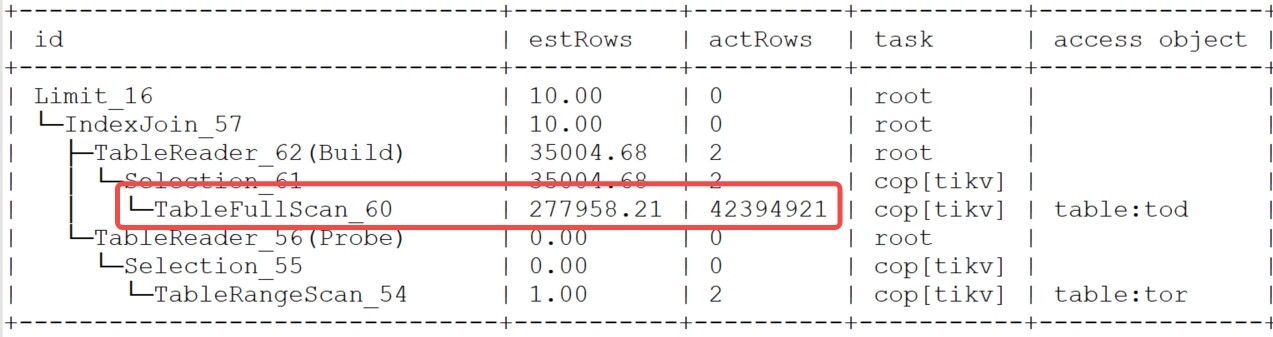
The same SQL, limit 100 is fast, but limit 10 is slow. The execution plans are different.
Could you share the execution plan? Let’s see where the differences are.
Limit 10 directly performs a full table scan
Index issue? Is the statistics health 100%?
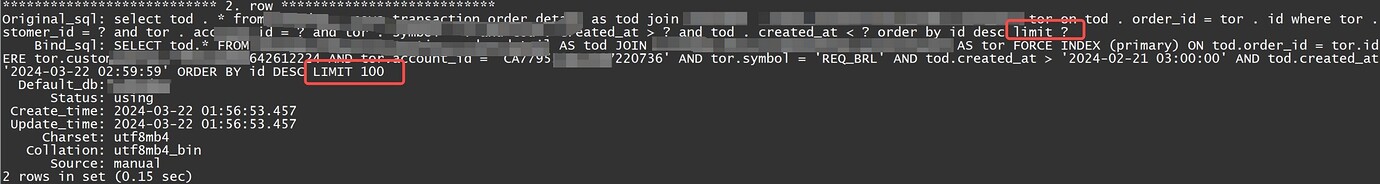
I forgot to mention, the background of this issue is that the join between two tables is forced to use the primary key. An execution plan binding was made using FORCE INDEX (primary) on tod.order_id = tor.id with a limit of 100. This statement was bound, but it seems that limit 15 was not used. However, if I bind limit 15, it will override limit 100.
This is the bound execution plan
If the SQL binding does not include a LIMIT clause, can the SQL follow the binding plan?
The image you provided is not accessible. Please provide the text content you need translated.
There is no issue with the health status, I’ll give it a try.
Even stranger, I wanted to try it on the replica, and found that the same query on the replica was also fast, and the execution plan was correct, using the primary key join.
 How about recollecting the statistics, getting the health to 100%, and then trying again?
These were just collected and executed. The data in these two tables is updated extremely frequently, making it very difficult to achieve 100%.
Do you have any other bindings on your primary database? Check if the execution plan is being followed, and which execution plan is being used?
Is there no binding plan on the replica? How about removing the binding plan and giving it a try? 
Confirming, looking at the execution plan, your SQL has a join. If you are doing a full table join without using the primary key, it should indeed be slow (because it doesn’t use the index). Based on your question, I feel it might be an issue with SQL binding not taking effect, right?
No, that’s the only sentence.
The replica does not need to be bound, it works the same way.
It is related to this setting. If all of them are affected, it should all be slow.