Note:
This topic has been translated from a Chinese forum by GPT and might contain errors.
Original topic: 已经下线的 tikv 节点上的 store 没有真正被删除
By executing the command
tiup ctl:v5.3.0 pd -u host:port store | grep "id\""
to view all stores, you can see the following information:
"id": 1,
"id": 4,
"id": 256612,
"id": 527844,
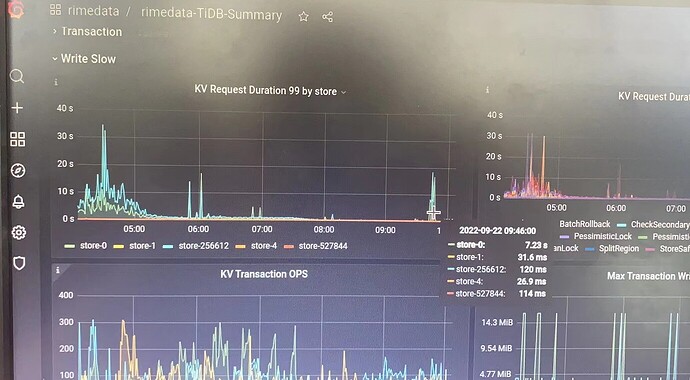
This means that the current TiDB cluster has only 4 stores, which are id 1, 4, 256612, and 527844. However, through Grafana, it is found that there is an additional store-0. Store-0 should be on a machine that has been taken offline before, but it has not been cleared.
I would like to ask how to clear this store-0.
tiup ctl:v5.3.0 pd -u host:port store 0 to check the status of the store with id=0
The image you uploaded is not visible. Please provide the text you need translated.
Failed to get store: [404] "store 0 not found", it shows not found, but I don’t know why there is still store-0 information in Grafana.
That node has already been taken offline. I remember executing the prune command before. Previously, due to machine issues, the --force command was used to forcefully take it offline.
Grafana might be caching. If the scaling down occurred within the query time range, the display is normal. If the scaling down occurred outside the query time range, the display is abnormal. You can try restarting the component to see if it has any effect.
Oh, so after using --force, you still need to manually delete that store.
The machine where store-0 is located has been offline for about two or three months. The Grafana data in the article is from today, so should I restart the Grafana component and check again?
Then I’ll go to the official website to find the command to manually delete a specific store and give it a try.
Is there no node corresponding to store-0 in the tiup cluster display? If it is already gone, then try restarting the Grafana component.
Isn’t the link you posted the command to delete the store?
Yes, that’s correct, there’s nothing else. However, there’s some background information that needs to be explained: previously, the machine where store-0 was located was scaled down, and after reinstalling the system, it was scaled back up.
I did execute this command before, so theoretically store-0 should indeed have been deleted. Executing tiup ctl:v5.3.0 pd -u http://10.20.70.39:12379 store also indeed does not find any information about store-0.
Then it should be gone. Try restarting the component.
After restarting the Grafana component, you can still see the information of store-0 in the KV Request 99 By store section of TiDB-Summary in Grafana.
 I’ve encountered this situation before. I forced a scale-in and then a scale-out, which led to information confusion. Later, I performed a normal scale-in and scale-out again, and it resolved the issue.
However, at this point, the node that was forcibly scaled down is already gone, and I can no longer scale down the node where store-0 is located.
There is no presence of store-0 in the related monitoring of PD.
Do you mean that store-0 is only in that one view?

