Note:
This topic has been translated from a Chinese forum by GPT and might contain errors.Original topic: tidb和窃电分析的故事
Those data statistics and TiDB stories
When I was a child, my dad did something very interesting.
At that time, we lived in an apartment building. Each household had its own meter plus a main meter. The electricity bill was collected by each household in turn. Anyway, from the time I can remember, the total of the main meter and each household’s meter never matched. It was always off by 20 or 30 yuan. The household responsible for the discrepancy had to cover it, or it was evenly distributed among all households, indicating that someone in the building was stealing electricity.
Later, it was discovered that the household in unit 302 was stealing electricity. They had two college students and were short on money, so they used their electrical knowledge to steal some electricity.
This simple addition and subtraction caught the thief. Why did we suspect them? They used only 1 kWh of electricity per month.
It was really absurd—absurd to the extreme.
When I was studying machine learning on Alibaba Cloud, there was an article about electricity theft analysis.
Using TiDB to predict stock returns and analyze stock cycles
User Electricity Theft Detection
- Enter the Designer page.
- Log in to the PAI console.
- In the left navigation bar, click Workspace List, and on the workspace list page, click the name of the workspace to be operated on to enter the corresponding workspace.
- In the workspace page’s left navigation bar, select Model Development and Training > Visual Modeling (Designer) to enter the Designer page.
- Build the workflow.
- On the Designer page, click the Preset Templates tab.
- In the template list’s User Electricity Theft Detection area, click Create.
- In the New Workflow dialog box, configure parameters (you can use all default parameters).
Among them: Workflow Data Storage is configured as the OSS Bucket path, used to store temporary data and models generated during workflow operation.
- Click OK.
You need to wait about ten seconds for the workflow to be successfully created.
- In the workflow list, double-click the User Electricity Theft Detection workflow to enter the workflow.
- The system automatically builds the workflow based on the preset template, as shown below.
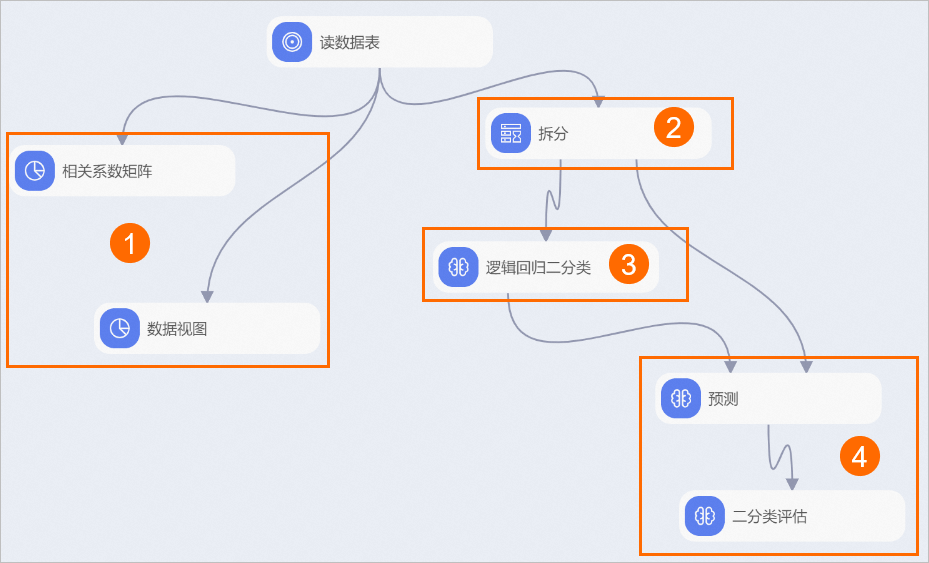
| Area | Description |
|---|---|
| ① | Statistical Analysis: |
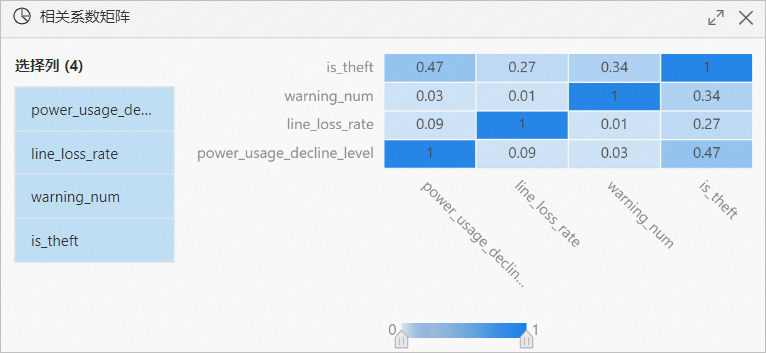
* Use the **Correlation Matrix** component to observe the impact of each feature on electricity theft.
* Use the **Data View** to see the data distribution relationship between each feature column and the target column. In this workflow, the **feature columns** are power_usage_decline_level, line_loss_rate, and warning_num, and the **target column** is is_theft.|
|②|Split the dataset into training and prediction datasets in an 8:2 ratio.|
|③|Use the Logistic Regression Binary Classification component to perform regression modeling on the training dataset. The training feature columns in this workflow are power_usage_decline_level, line_loss_rate, and warning_num, and the target column is is_theft.|
|④|Use the Prediction component to predict the model’s effect on the prediction dataset, and use the Binary Classification Evaluation component to evaluate the model’s prediction accuracy.|
3. Run the workflow and view the output results.
- Click the run button at the top of the canvas
 .
. - After the workflow runs, right-click the Correlation Matrix on the canvas, and in the shortcut menu, click Visual Analysis.
- In the Correlation Matrix dialog box, view the impact of each feature on electricity theft.
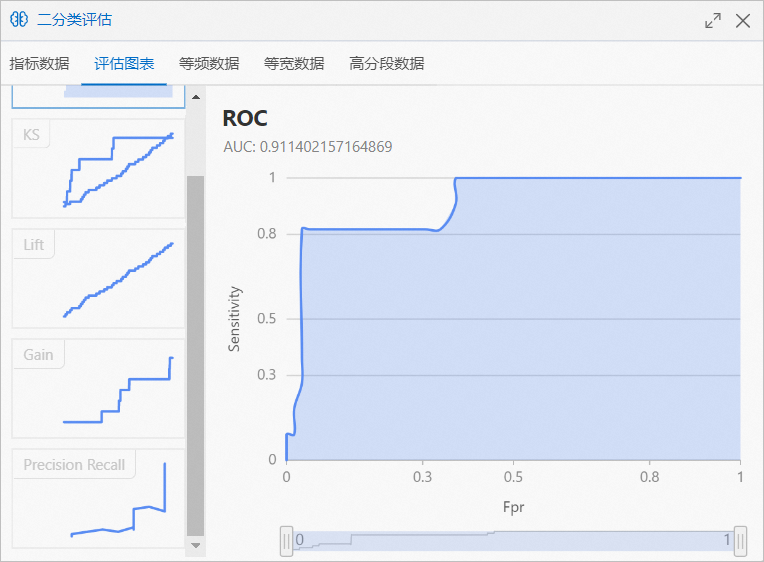
- Right-click the Binary Classification Evaluation on the canvas, and in the shortcut menu, click Visual Analysis.
- In the Evaluation Report dialog box, click the Evaluation Chart tab to view the model evaluation metrics.
I will write about how to use TiDB for electricity theft analysis later. After all, we are also an AI database, haha.
When I was sent by Tang Cheng to work in the power sector, I was very puzzled as to why electricity meter statistics had to be at the second level. It had to produce 40TB of data a day. PostgreSQL was not enough; Hive was also needed to calculate the data. That is, the same data was stored in Oracle, PG, and Bigtable. The data center occupied an entire building.
Later, I realized that power companies are the major users of machine learning.
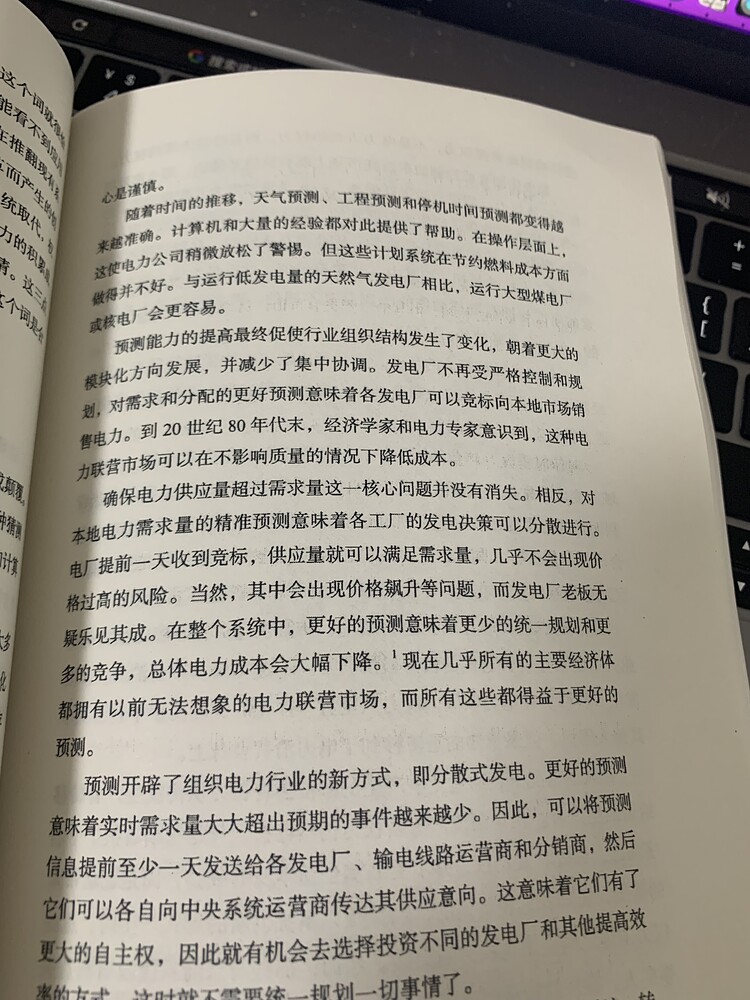
Electricity cannot be stored; it must be produced and used in equal amounts. It requires predicting peaks and troughs. This is our major employment direction.
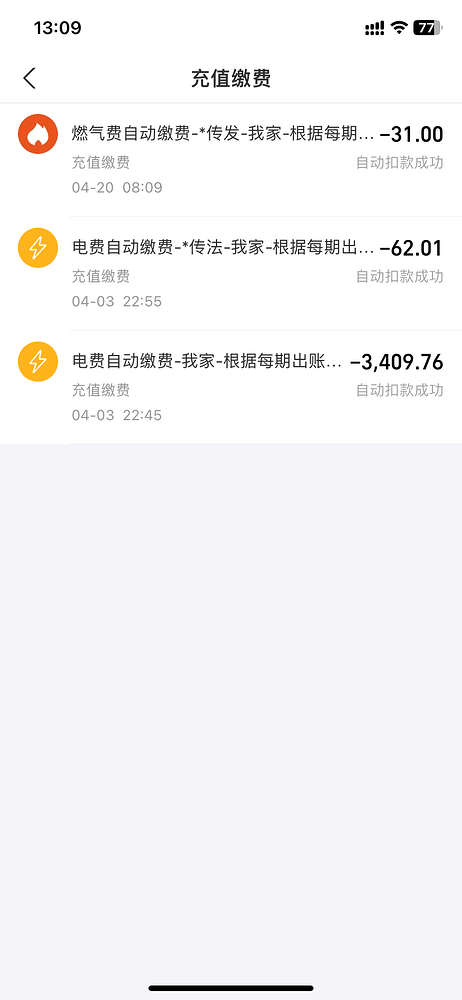
Enough said, I need to pay my 5000-6000 yuan electricity bill.