Note:
This topic has been translated from a Chinese forum by GPT and might contain errors.
Original topic: TiCDC同步到下游TiDB集群时速率很慢
[TiDB Usage Environment] Production Environment
[TiDB Version] V6.3.0
Help, help!!!
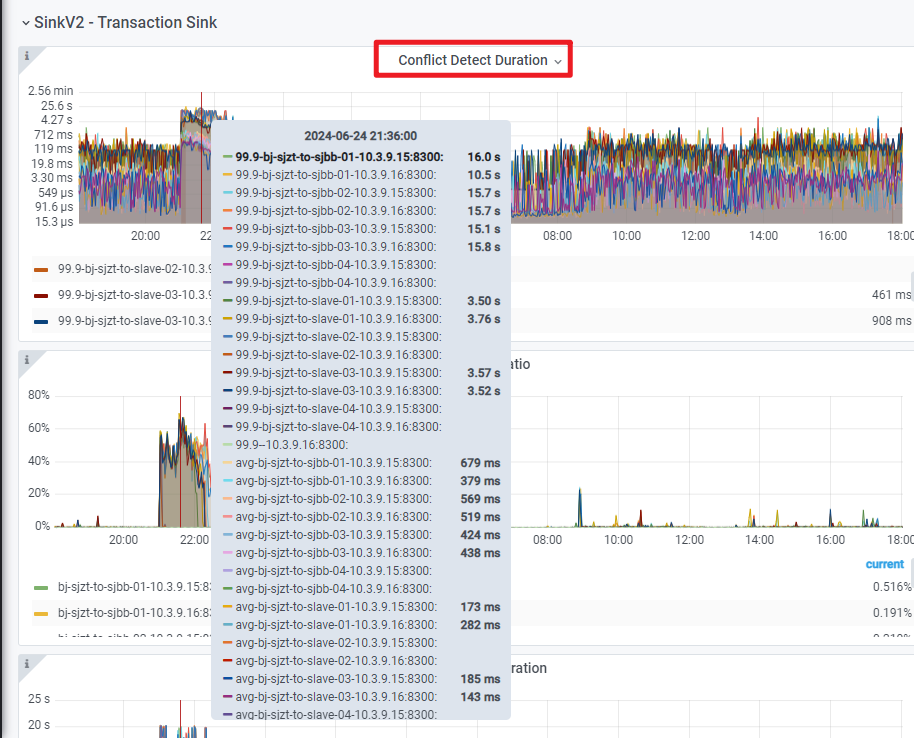
Our TiCDC is experiencing slow synchronization rates when syncing to the downstream TiDB cluster. Monitoring shows an abnormal metric, which is the conflict detection time in the image below, taking several seconds. Why is this happening? Ps. Our sync table is a large table with 300 million records.
Check the CDC logs. There might be overlapping tables in the task configuration or data conflicts.
Take a look at some WARN or ERROR logs in the CDC logs.
There are a lot of the following alarms in the system:
[2024/06/25 21:02:58.717 +08:00] [WARN] [system.go:578] [“actor poll received messages too slow”] [duration=1.929320332s] [id=6] [name=sorter-compactor]
[2024/06/25 21:03:02.853 +08:00] [WARN] [pd.go:152] [“get timestamp too slow”] [“cost time”=50.068307ms]
[2024/06/25 21:03:09.157 +08:00] [WARN] [pd.go:152] [“get timestamp too slow”] [“cost time”=353.648823ms]
There are a large number of warnings in the CDC logs as follows:
[2024/06/25 21:02:58.717 +08:00] [WARN] [system.go:578] [“actor poll received messages too slow”] [duration=1.929320332s] [id=6] [name=sorter-compactor]
[2024/06/25 21:03:02.853 +08:00] [WARN] [pd.go:152] [“get timestamp too slow”] [“cost time”=50.068307ms]
[2024/06/25 21:03:09.157 +08:00] [WARN] [pd.go:152] [“get timestamp too slow”] [“cost time”=353.648823ms]
Uh, is your resource usage very high? It seems that getting TSO and sorting data both take quite a long time.
Yes, the sorting time is relatively long, but the memory, IO, and CPU usage of CDC are not high, so it’s unclear where the bottleneck is.
I checked, and indeed the TSO is relatively high. What factors affect this TSO? Isn’t it just obtaining a timestamp from PD? How does it slow down?
Is the PD server very busy?
How is the cluster load? For example, memory usage, CPU usage? Is the cluster load too high?
Yes, there are many write conflict alarms, and looking at the monitoring, the time taken for conflict resolution is often very long, around 10 seconds.
It looks like your write operation hasn’t been committed for a long time and has been rolled back. Then it keeps retrying  .
.
Yes, how could this happen?
Go to the downstream TiDB and analyze where the SQL execution is slow.