Note:
This topic has been translated from a Chinese forum by GPT and might contain errors.
Original topic: tidb 取事务 Start Ts 耗时比较高
[TiDB Usage Environment] Production Environment
[TiDB Version] 5.3.3
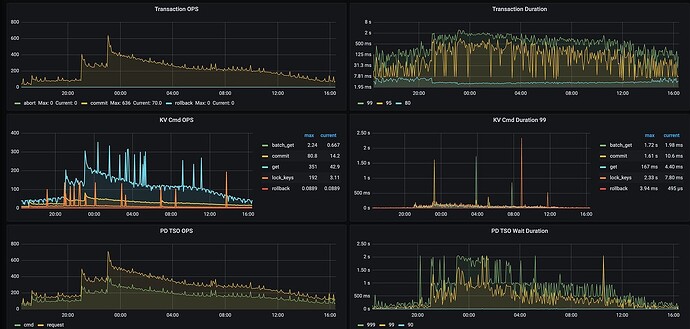
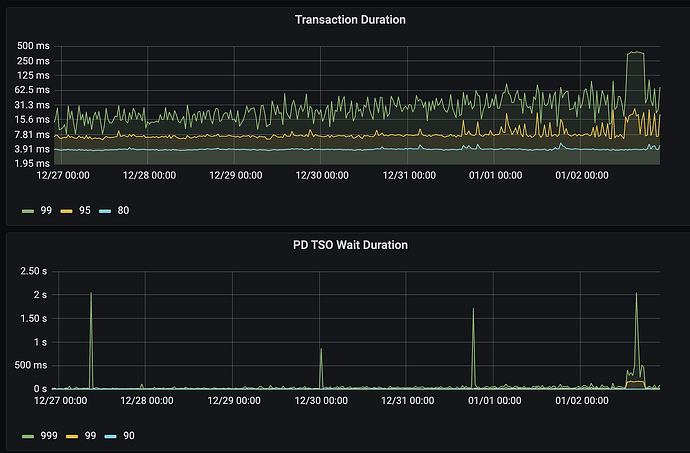
The TiDB monitoring shows that the time to obtain TSO is long.
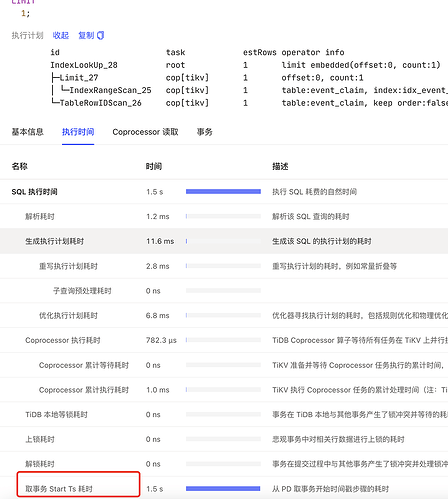
The slow query log indeed shows that the time to obtain TSO is long:
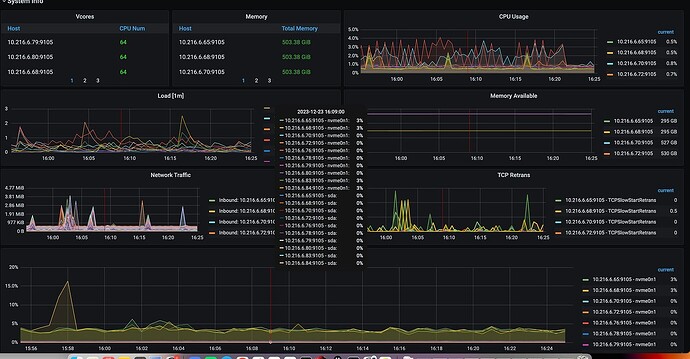
The machine configuration is 64 cores, 512GB RAM, and NVMe disks.
Obtaining startTS involves tidb-server accessing the PD Leader to get the TSO. This process takes a relatively long time, so it’s necessary to investigate the monitoring status of this chain.
You can troubleshoot and confirm the following directions:
- Check the network latency and jitter between tidb-server and PD leader.
- Inspect the PD cluster, especially whether the PD leader is busy, focusing on its CPU usage and other metrics.
- Check the GRPC call latency to confirm whether the network request calls are normal.
Try cutting off the PD leader.
What about the logs? Check if there are any abnormal logs in tidb.log and pd.log.
No issues were found in the log check either.
Check the load status of PD and the network conditions.
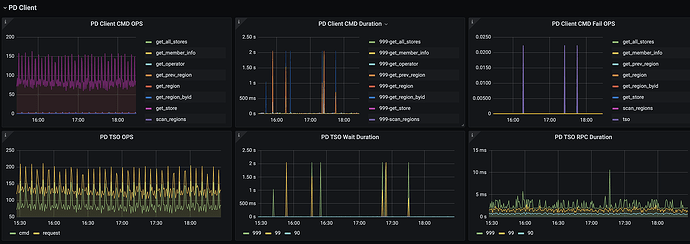
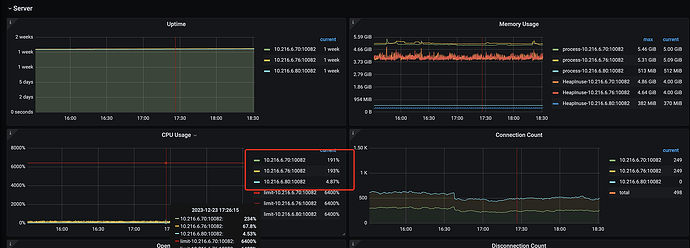
Simply looking at this image, the issue might be on the TiDB server side. Focus on checking various monitoring tools and logs to see if there are any anomalies.
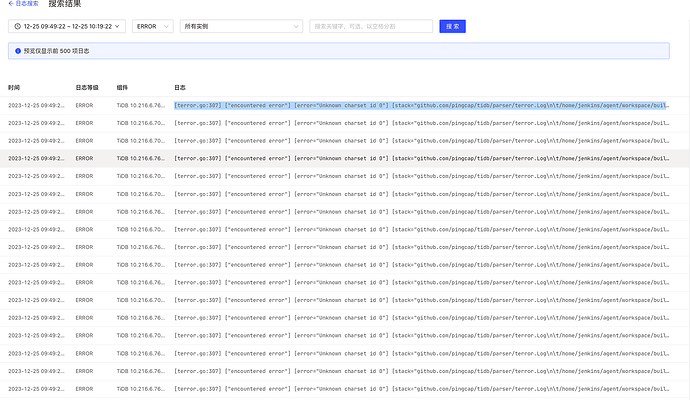
The error message on the TiDB server is as follows:
[terror.go:307] [“encountered error”] [error=“Unknown charset id 0”] [stack=“github.com/pingcap/tidb/parser/terror.Log\n\t/home/jenkins/agent/workspace/build-common/go/src/github.com/pingcap/tidb/parser/terror/terror.go:307\ngithub.com/pingcap/tidb/server.(*Server).onConn\n\t/home/jenkins/agent/workspace/build-common/go/src/github.com/pingcap/tidb/server/server.go:520”]
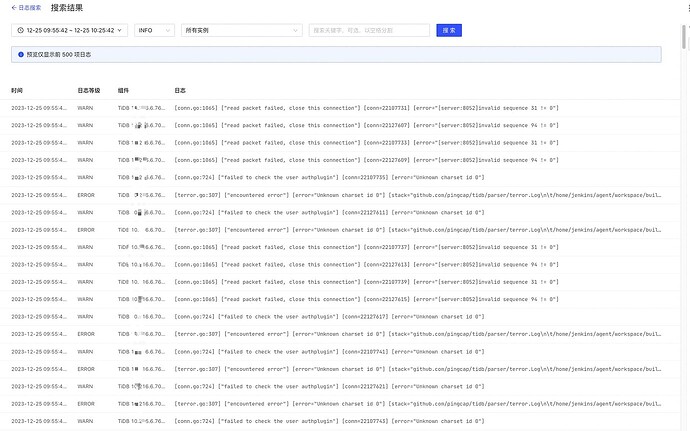
All logs of tidb-server:
[conn.go:1065] [“read packet failed, close this connection”] [conn=22107731] [error=“[server:8052]invalid sequence 31 != 0”]
[conn.go:724] [“failed to check the user authplugin”] [conn=22107735] [error=“Unknown charset id 0”]
The load on PD is very low:
It might be a performance issue with PD.
Looking at the monitoring, it seems like an issue with tidb-server; however, it’s not clear what the problem is yet.
I wonder if not disabling NUMA on the server could cause this issue?
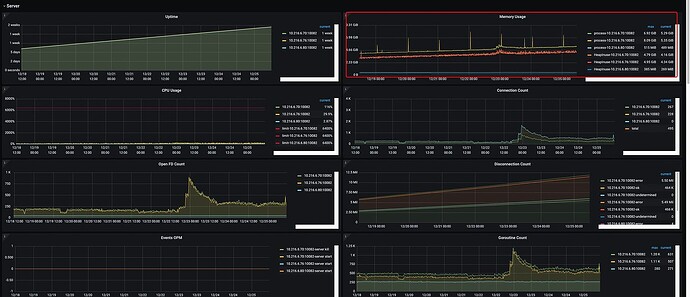
The memory usage of tidb-server seems to be slowly increasing, but it’s not very obvious.
- Is it a mixed deployment?
- Check the monitoring screenshots for the problematic time periods. I see your screenshots cover various time periods.
- Logs should also be checked for issues corresponding to the specific nodes and time periods.
- Are the 3 TiDB servers not load balanced? I see all connections are on two nodes, and there are no connections on the other node.
- This also seems problematic; the requests are actually higher than the commands.
Additionally, could you share the monitoring graph for the start TSO wait duration?
After moving the tidb-server to a new machine, the TSO retrieval time has been reduced to within 10 milliseconds, but it still needs further observation.
After cutting the tidb-server, although the TSO acquisition latency has decreased significantly, it still feels a bit abnormal and somewhat high. Other clusters have a 99th percentile latency of around 3ms and a 90th percentile latency of around 450us. This is a bit high, so let’s keep observing it.
Also take a look at the business operation situation.
After re-splitting the TiDB nodes, the TSO retrieval time gradually increased after running for a week. Currently, retrieving TSO at the 999th percentile has become around 100 milliseconds, and at the 99th percentile, it has become around 20-30 milliseconds.
Occasional jitter is not a big issue, but the 20-millisecond increase in the 99th percentile TSO is a bit high.
The transaction execution time is also gradually increasing.
