Note:
This topic has been translated from a Chinese forum by GPT and might contain errors.
Original topic: tidb-server tso获取时间缓慢升高
[TiDB Usage Environment] Production Environment
[TiDB Version] 5.3.3
[Reproduction Path]
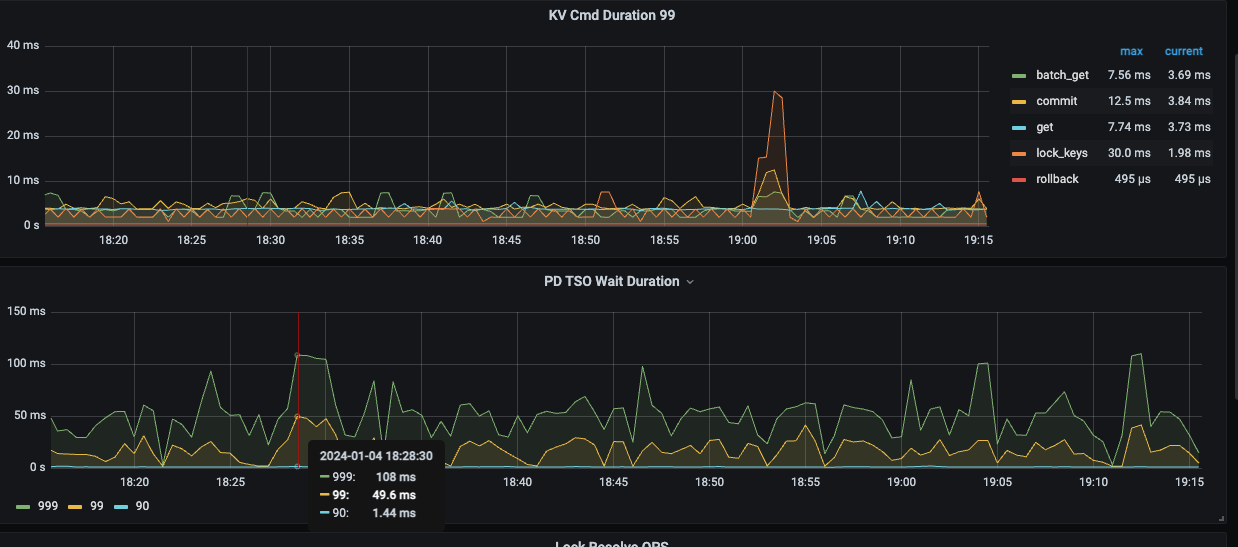
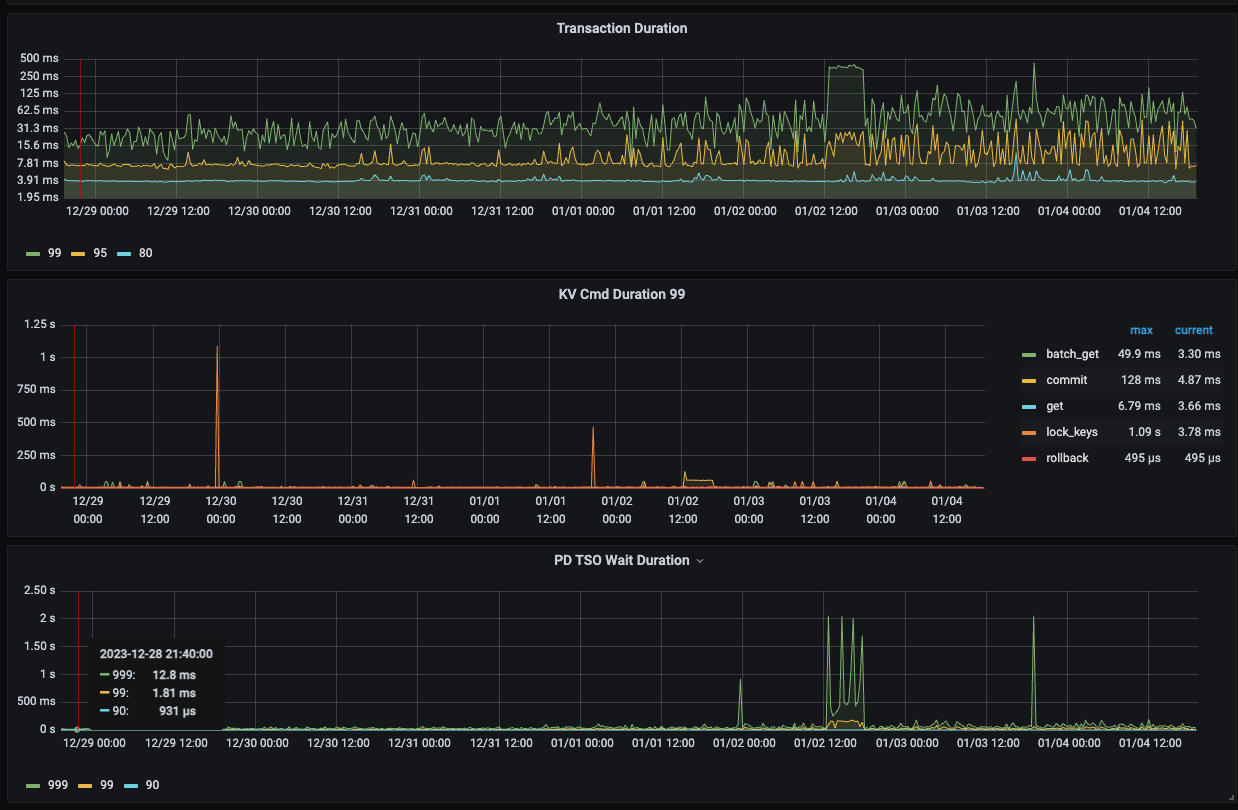
After restarting the tidb-server, the TSO time will recover. However, over time, approximately one week later, the 99th percentile TSO time will increase from around 1 millisecond to about 30 milliseconds, and the 999th percentile will increase from 20 milliseconds to 60 milliseconds, and it will continue to rise thereafter.
[Impact] Slow queries will occur, and the time to obtain TSO will increase.
[Resource Configuration] The resource configuration is 64c 512G NVMe disk.
TSO screenshot from the last hour:
TSO screenshot from the last 7 days:
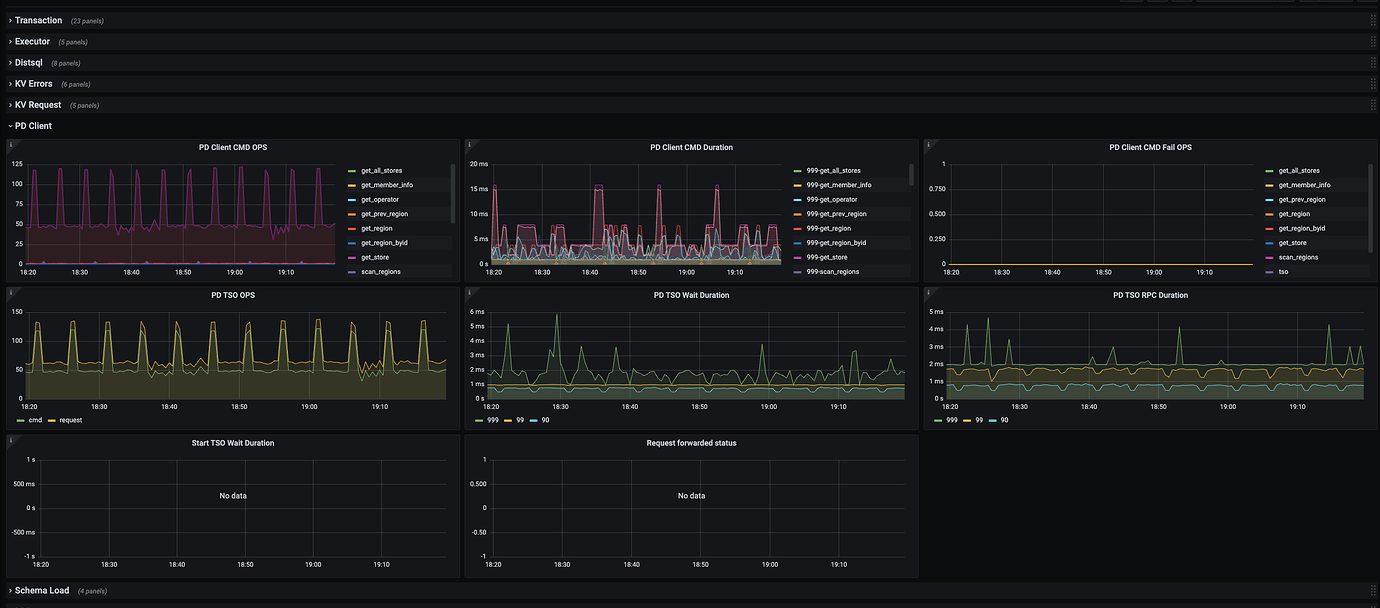
tidb-pdclient TSO screenshot from the last hour:
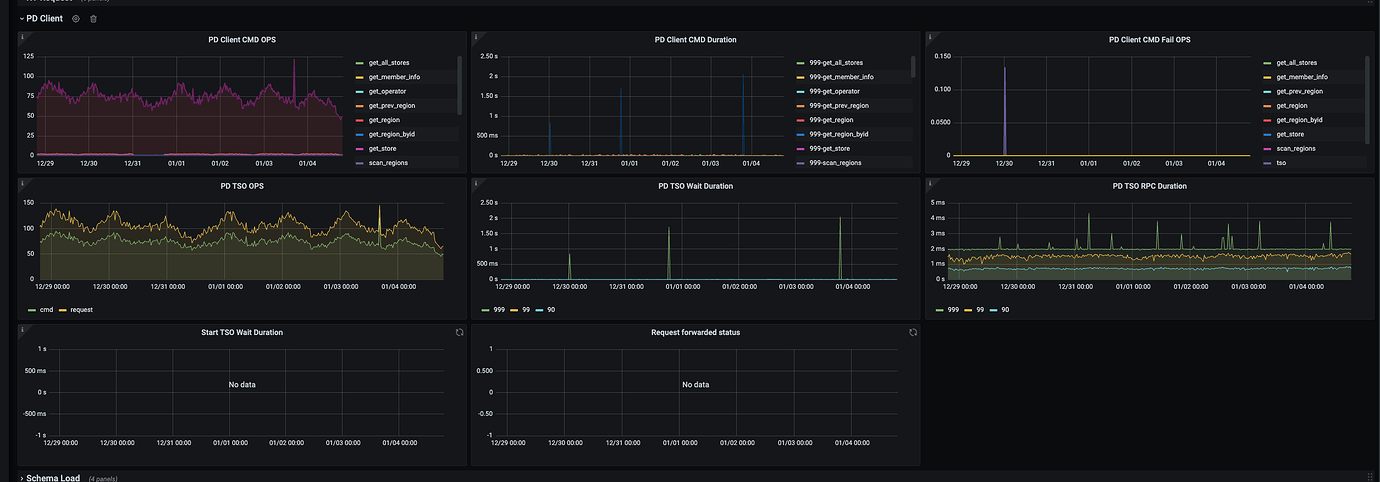
tidb-pdclient TSO screenshot from the last 7 days:
Confirm whether there are any abnormal logs for the PD client access in TiDB, and also check if the network latency is normal.
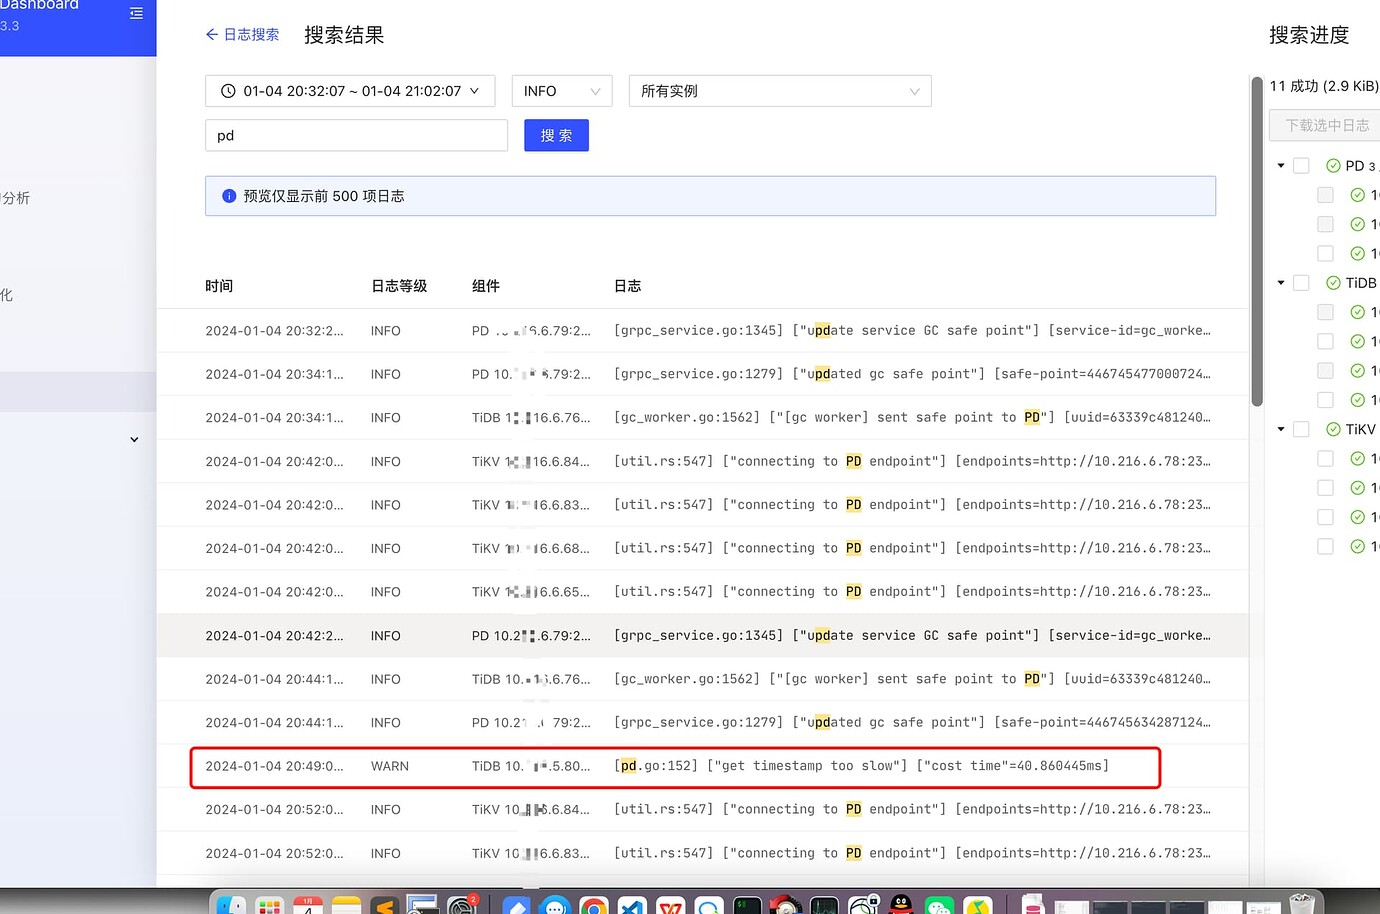
Search for logs related to PD:
[pd.go:152] [“get timestamp too slow”] [“cost time”=40.860445ms]
Network latency and ping values are all normal. There are other TiDB clusters in this data center, and they are all relatively normal. Only this one cluster is not quite normal.
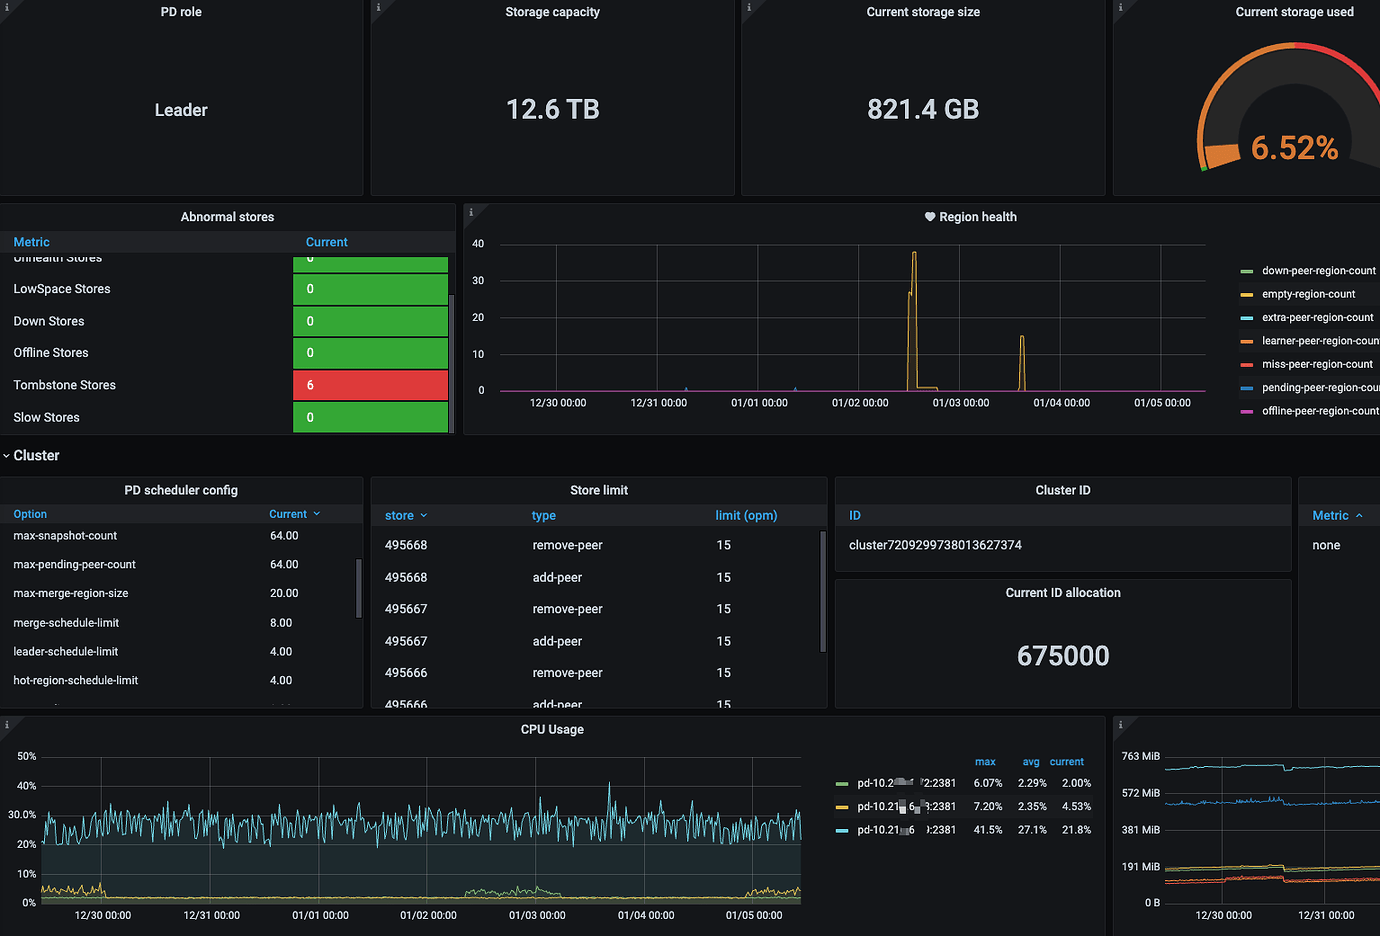
Confirm the CPU status of the machine where the PD leader node is located.
The CPU usage of both PD and TiDB nodes is not high.
CPU usage of PD nodes in the last 7 days:
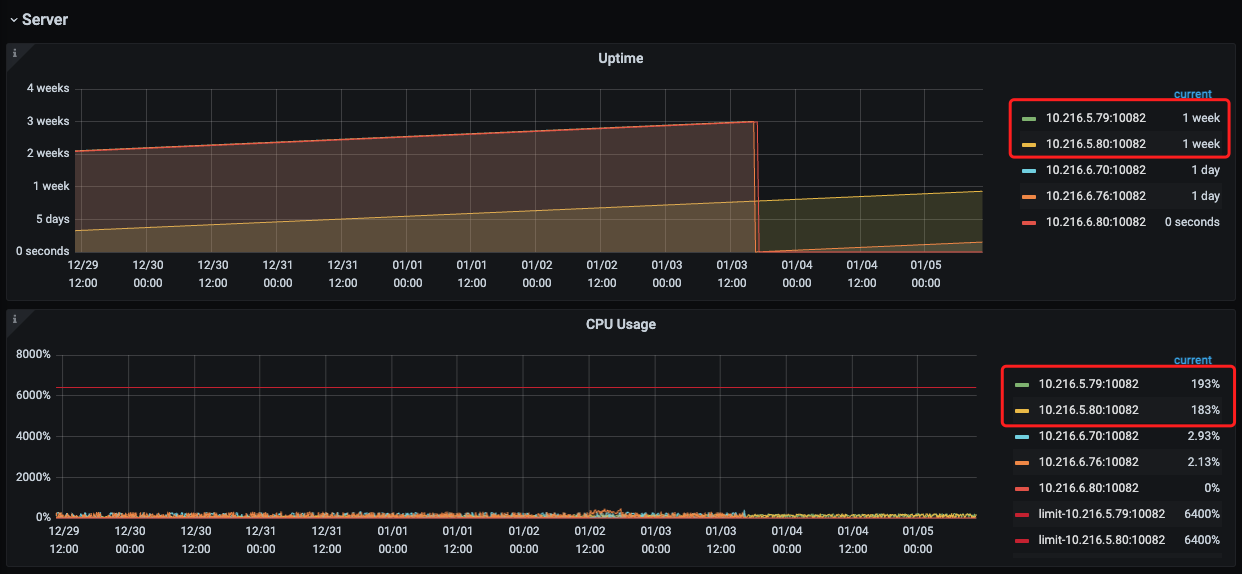
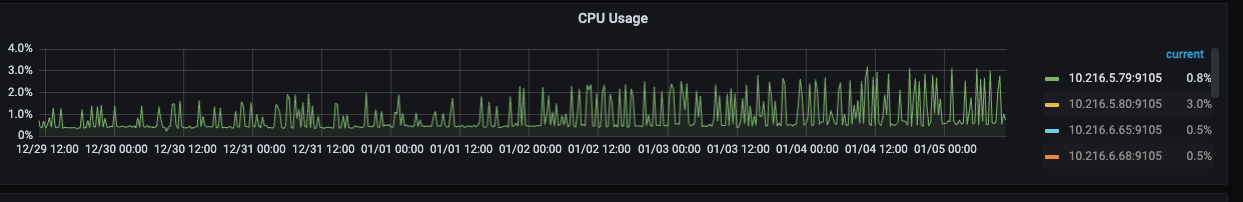
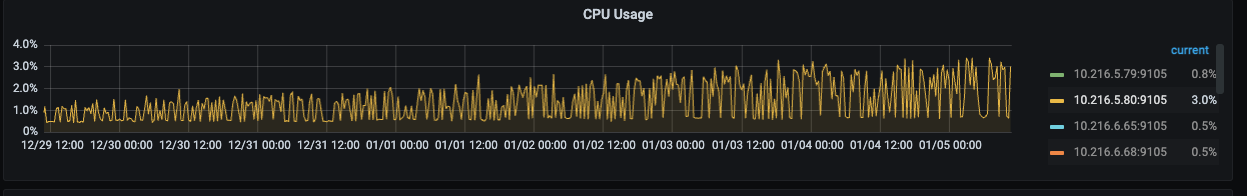
CPU usage of TiDB nodes in the last 7 days:
In the monitoring, the top 2 TiDB nodes are in use by the business, while the bottom 3 TiDB-server nodes are not in use by the business and were temporarily added for troubleshooting.
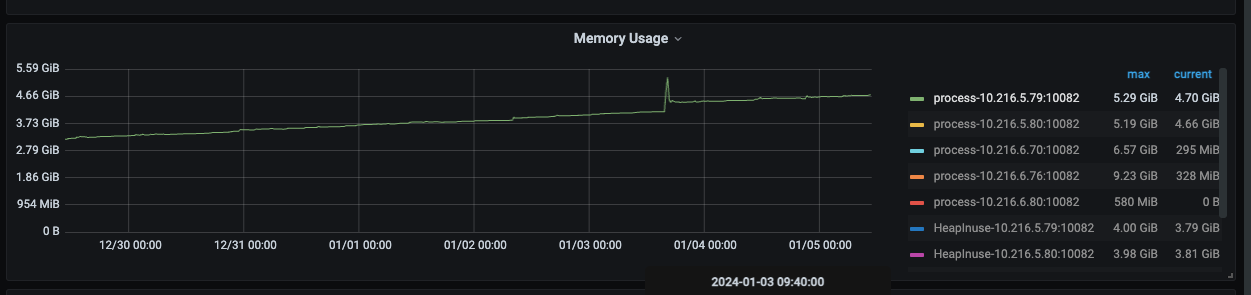
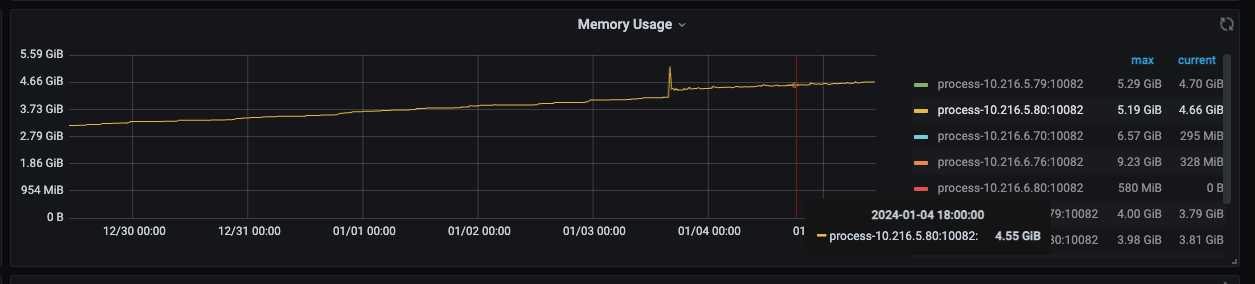
Additionally, I noticed from the monitoring that the CPU and memory usage of the TiDB-server nodes gradually increase after a restart, even though the business has not changed.
Memory changes over 7 days:
CPU changes over 7 days:
Here is a troubleshooting guide that starts from these three directions and eliminates them one by one. You have already checked the network issue above and confirmed it is normal, so you can focus on analyzing the issues with PD or TiDB.
- Network is slow
- PD is stuck
- TiDB is stuck
Network is slow
First, immediately check the PD TSO RPC Duration. The normal value range is about 1ms for 80% and within 4ms for 99%. If the value is relatively high, it indicates that the network and PD processing time are long (including Go Runtime scheduling and actual TSO processing logic). At this point, continue to check whether the PD server TSO handle time + Client recv time is slow. If it is not slow, it means that PD TSO processing (and sending) is not slow, and it is most likely a network issue that needs to be investigated in the direction of network problems.
PD is stuck
If the PD server TSO handle time + Client recv time is slow:
- If it is version v4.0.13 and later, since this monitoring only includes the PD leader processing TSO time, its slowness indicates that PD TSO processing is slow. At this point, you should check whether the CPU usage of the PD Leader is high and whether there is a mixed deployment situation, i.e., other processes or operations on the same machine are disrupting PD’s calculations, affecting the TSO processing speed.
- If it is before version v4.0.13 (not included), it indicates that the PD leader processing TSO time is slow, or the time to send back to the client is slow, or both are relatively slow. You need to consider the above PD CPU issues and the network issues between PD and TiDB.
Another situation that can affect PD’s TSO allocation is PD leader switching. However, generally, when a leader switch occurs, it directly causes TSO to be unavailable and cannot be the reason for TSO slowing down. This is mentioned here for reference only.
TiDB is stuck
If network issues and PD issues are successfully ruled out, then the suspicion returns to TiDB. Since the background processing flow of TSO and TiDB’s Parser and Compile to generate Plan are carried out simultaneously, encountering high-intensity workloads and some more complex queries may consume a lot of resources, affecting the Wait operation (which uses select statements and channels, involving Go’s scheduling). At this point, you can go to TiDB’s Execution monitoring panel to see the time consumption of Parse, Compile, and Execute.
Well, I have read this article on troubleshooting slow TSO acquisition many times. Currently, the preliminary diagnosis points to an issue with the tidb-server. Restarting it can temporarily resolve the issue, but it only lasts for a week. So, I still want to come up with specific troubleshooting guidelines to identify the exact problem.
How is the memory of the TiDB server node?
The memory usage rate is very low, with 512G of memory, about 5G is being used. However, it is slowly increasing.
Check if PD is functioning properly and if GRPC is functioning properly.
Didn’t find anything in the pdclient logs.
Currently, it seems that PD is functioning normally. I have switched PD, but it had no effect.
At present, it does seem to be an issue with tidb-server, and a restart can temporarily resolve it. It currently feels like a memory leak is causing it, with memory gradually increasing, leading to slower TSO acquisition.
Submit an ISSUE, don’t nitpick the code, focus on the principles, and analyze the parts that don’t make sense.
Your description… I feel like the tidb-server go routine overflowed… Check if the number of goroutine threads is continuously increasing. It’s available in the monitoring.
Later, based on the suggestion, I set tidb_analyze_version=1; however, the memory usage of the tidb-server continues to increase.
The image you provided is not accessible. Please provide the text you need translated.
I captured the heap memory of the tidb-server node.
new_heap.profile (1.1 MB)