Note:
This topic has been translated from a Chinese forum by GPT and might contain errors.
Original topic: TiCDC 告警指标
[TiDB Usage Environment] Production
[TiDB Version] 5.0.4
[Encountered Issues]
-
Why is there a significant delay?
-
How to resolve these alerts?
Alert metrics show many alerts:
Alert metric cdc_checkpoint_high_delay metrics:
(time() - ticdc_processor_checkpoint_ts /1000) >600
Alert query results:
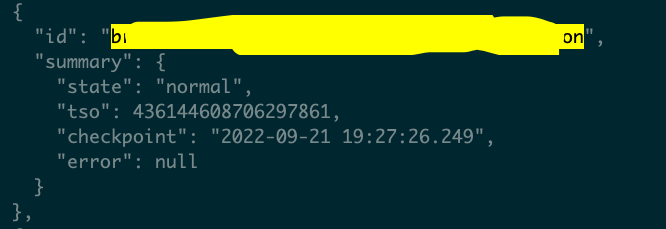
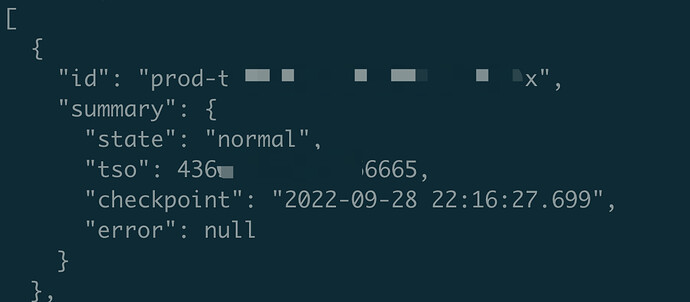
Check changefeed checkpoint_ts status:

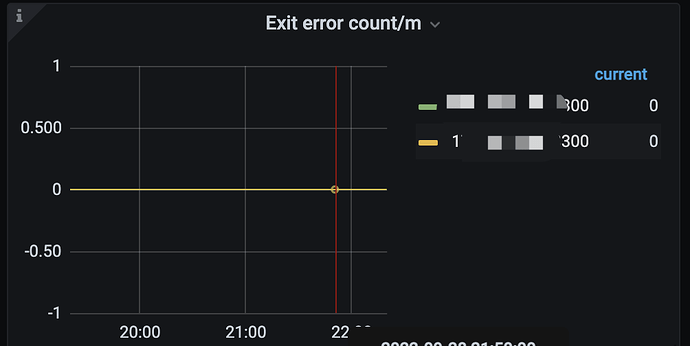
Grafana delay status:
Click on the Grafana metrics to see how the “changefeed checkpoint” metric is calculated?
- The two metrics are different and cannot be compared together.
changefeed checkpoint lag --dashboard
max(ticdc_owner_checkpoint_ts_lag{tidb_cluster="$tidb_cluster", changefeed=~"$changefeed"}) by (changefeed)

cdc_checkpoint_high_delay alert metric:
(time() - ticdc_processor_checkpoint_ts /1000) >600
- How can I eliminate the cdc_checkpoint_high_delay alert delay?
You can first refer to the documentation for troubleshooting:


