Note:
This topic has been translated from a Chinese forum by GPT and might contain errors.
Original topic: TICDC 向一表一TOPIC分发数据,经常莫名卡死,不再有新的数据写入
I searched on ASK and found similar issues that were supposedly resolved, but I’m still encountering this problem in version v6.5.3. Could you please tell me in which version this bug is fixed? Or is there any temporary workaround? This issue is almost rendering the event distribution to KAFKA useless!!!
Is there really no one replying? When will version V6.5.4 be released???
When describing the problem, please follow:
【TiDB Usage Environment】Production Environment / Testing / PoC
【TiDB Version】
【Problem Phenomenon and Impact】
【Reproduction Path】What operations were performed that led to the problem
【Resource Configuration】
Describe as much effective background information as possible. Many problems may have different suggestions under different scenarios and business contexts. If you don’t explain clearly, it will be difficult for others to help you~
By describing all the information clearly, the problem can be located faster, and the efficiency of solving the problem will be quicker~
This error message is from DM (Data Migration), indicating that the etcd client’s outCh blocking time is too long, possibly due to the etcdWorker being stuck. This issue could be caused by problems with the etcd cluster or the DM Worker. It is recommended to first check the status of the etcd cluster to ensure it is running normally. You can check the status of the etcd cluster using the following command:
etcdctl --endpoints=<etcd-endpoints> endpoint status
If the etcd cluster status is normal, you can try restarting the DM Worker to see if it resolves the issue. You can restart the DM Worker using the following command:
systemctl restart dm-worker
If the problem persists, it is recommended to check the DM Worker logs to see if there are any other error messages. You can view the DM Worker logs using the following command:
tail -f /path/to/dm-worker.log
If you need more detailed assistance, please provide more context information, and I will do my best to help you resolve the issue.
- This log is from cdc.log, and it usually appears after a brief period of normal operation following a restart.
- There are no anomalies in the dm log.
- The cluster status is also normal.
For more details, see BUG #9073 (changefeed stucks "etcd client outCh blocking too long, the etcdWorker may be stuck" · Issue #9073 · pingcap/tiflow · GitHub), Fixed by #9074. This issue seems to have been fixed but does not appear to be included in the V6.5.3 release package, even though the fix was made before the V6.5.3 release date.
It looks like it has been merged into release-7.1.
After I upgraded to 6.5.3, I also restarted CDC, and everything crashed. There was no data being written to the downstream. How did you resolve this on your end?
Could you provide the stack trace information when CDC is stuck? If possible, please also provide the logs and monitoring data.
The cherry-pick PR to 6.5 was directly closed because the changes were included in this PR and merged into the 6.5 branch. Cherry pick 8949,8989,8983,9010,9074,9091 to release 6.5 by hicqu · Pull Request #9100 · pingcap/tiflow · GitHub. We need to analyze the reasons.
Where else can version 6.5.3 be updated?
Hello, is the issue still present?
- Could you use the following script to capture the goroutine information of cdc when the issue occurs?
#!/bin/bash

# Before using this script, you need to modify the addresses in this list to the addresses where you want to download the cdc profile
HOSTLIST=("127.0.0.1:8300")  # Define the list of servers to connect to

for host in "${HOSTLIST[@]}"
do
		h=${host%%:*}
		p=${host#*:}
    echo $h $p
    # Download three files based on the host and port
    curl -X GET http://${h}:${p}/debug/pprof/profile?second=120s > cdc.profile
    curl -X GET http://${h}:${p}/debug/pprof/goroutine?debug=2 > cdc.goroutine
    curl -X GET http://${h}:${p}/debug/pprof/heap > cdc.heap

		dir=$h.$p
    # Package the downloaded files into a folder and compress the folder into a $dir.tar.gz file
    mkdir $dir
    mv cdc.profile cdc.goroutine cdc.heap $dir
    tar -czvf $dir.tar.gz $dir
    rm -r $dir
done
- Could you provide the desensitized cdc logs? Only the logs printed by processor.go, changefeed.go, and all ERROR level logs are needed.
Currently, TiCDC only supports synchronizing TiDB clusters with up to 100,000 tables (including the latest 6.5 version). You can add [filter.rules] in the changefeed configuration to filter out unnecessary tables, thereby reducing the number of tables to be synchronized.
https://docs.pingcap.com/zh/tidb/stable/ticdc-changefeed-config
Take a look at the corresponding package.
Hello user, if possible, please also provide the monitoring data of ticdc during the problematic period. Thank you!
Please see the attachment for details, I hope it can provide some help to you.
dumpcdc2.log (56.6 MB)
127.0.0.1.8300.tar.gz (171.3 KB)
@Hacker_cjOH9cK0 Is the dumpcdc2.log filtered based on certain keywords? I found “Sink manager backend sink fails” in the log, but there’s no “Sink manager closing sink factory.” This is very strange; looking at the code, it shouldn’t happen. If this log is filtered, could you please provide an unfiltered original log?
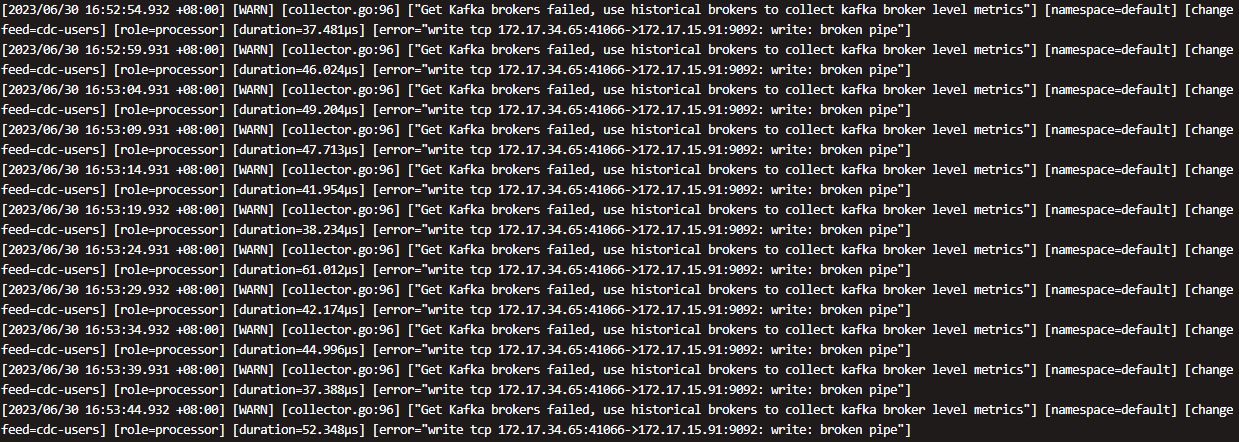
Please refer to the full logs. Additionally, could this kind of screen-filling error be caused by some bugs? My KAFKA cluster is functioning normally.
dumpcdc3.log.gz (4.5 MB)
@Hacker_cjOH9cK0 Received, thank you! Additionally, you can temporarily roll back ticdc to 6.5.2 to avoid this issue.