[TiDB Usage Environment] Production Environment
[TiDB Version] 5.4.2
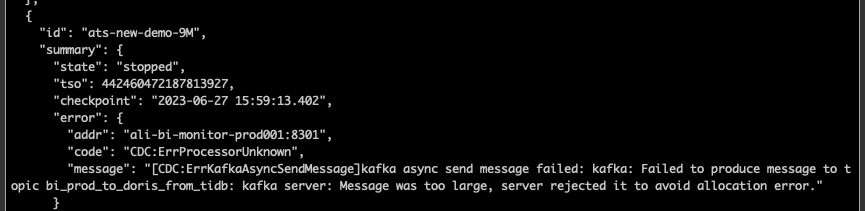
[Reproduction Path] The checkpoint timestamp in CDC suddenly stops updating
[Encountered Problem: Symptoms and Impact]
[Resource Configuration] Go to TiDB Dashboard - Cluster Info - Hosts and take a screenshot of this page
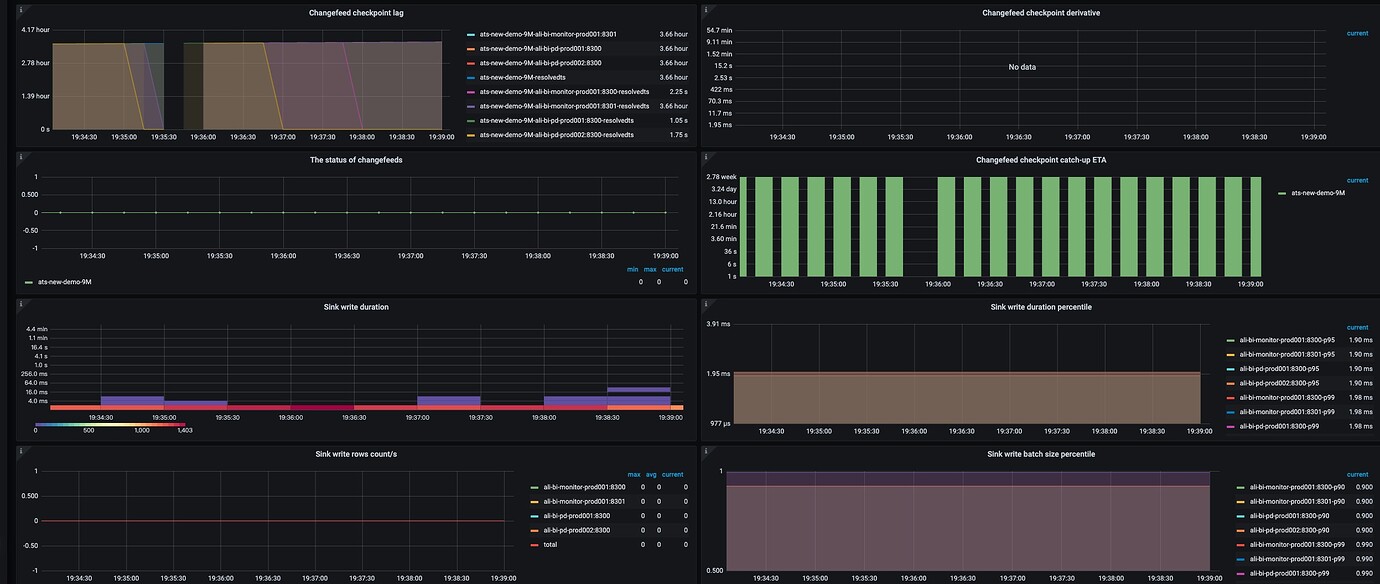
[Attachments: Screenshots/Logs/Monitoring]
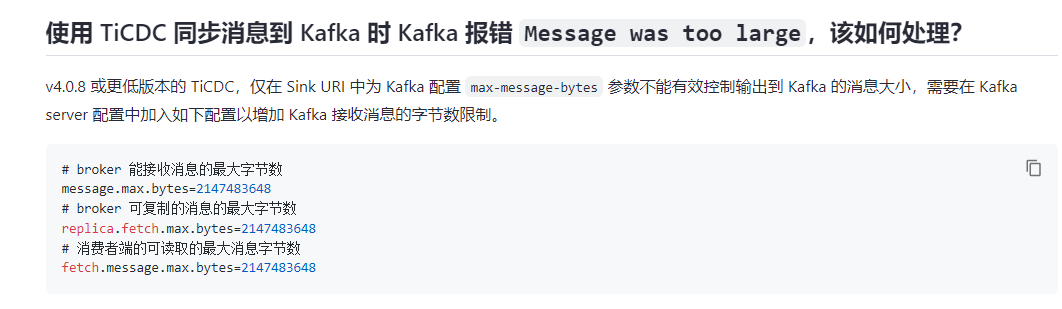
The Kafka we are using is from Alibaba Cloud, and it has already been adjusted to the maximum of 10M. What are the solutions for modifying TiCDC at the moment?
Based on your description, the issue might be caused by the TiCDC checkpoint TSO not changing. TiCDC periodically records the checkpoint TSO for recovering synchronization tasks. If the checkpoint TSO does not change, it may cause synchronization tasks to fail.
To resolve this issue, check whether the TiCDC synchronization tasks and monitoring metrics are normal. You can follow these steps:
Check if the TiCDC synchronization tasks are normal. You can use the TiCDC command-line tool tiup ctl or the PD monitoring panel to view the status of TiCDC synchronization tasks. If the synchronization task status is normal, you can rule out issues caused by abnormal synchronization tasks.
Check if the TiCDC monitoring metrics are normal. You can use the TiCDC monitoring panel or Grafana to monitor TiCDC metrics, such as checkpoint TSO and resolved TS, to see if there are any abnormal fluctuations or persistent unchanging conditions.
If there are anomalies in the TiCDC monitoring metrics, try restarting the TiCDC nodes or using TiCDC’s dynamic parameter adjustment feature to gradually adjust parameters and observe if the monitoring metrics return to normal.
If the TiCDC monitoring metrics are normal but there are still alerts, try adjusting the alert rules, such as changing the alert thresholds or alert intervals, to reduce false positives.
Note that TiCDC synchronization tasks are complex and require analysis and resolution based on specific circumstances. It is recommended to back up your data before resolving the issue to prevent data loss. Additionally, when deploying TiCDC, set the parameters reasonably according to actual business conditions and hardware configurations to avoid issues such as abnormal synchronization tasks or monitoring metrics.