Note:
This topic has been translated from a Chinese forum by GPT and might contain errors.
Original topic: TiCDC同步数据到MySQL不知道什么原因延迟的不断增大
【TiDB Usage Environment】Production
【TiDB Version】
V5.0.3
【Encountered Problem】
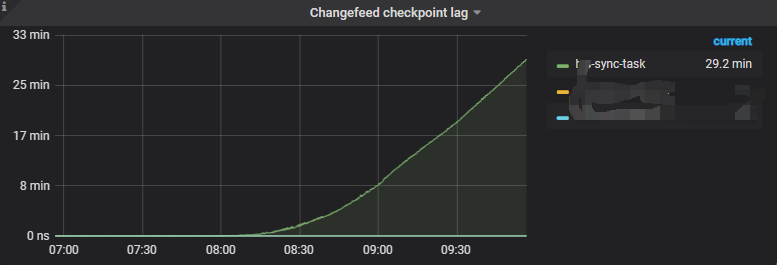
The TiCDC task synchronizing MySQL has been running for over a month, but this morning, the synchronization delay started to increase continuously. However, the data write volume of the upstream TiDB cluster has not changed, and there are no changes in the downstream MySQL either.
CDC node logs are as follows:
cdc.log.tar.gz (5.8 MB)
【Reproduction Path】
【Problem Phenomenon and Impact】
【Attachments】
- Relevant logs, configuration files, Grafana monitoring (https://metricstool.pingcap.com/)
- TiUP Cluster Display information
- TiUP Cluster Edit config information
- TiDB-Overview monitoring
- Corresponding module Grafana monitoring (if any, such as BR, TiDB-binlog, TiCDC, etc.)
- Corresponding module logs (including logs from 1 hour before and after the issue)
For questions related to performance optimization and troubleshooting, please download the script and run it. Please select all and copy-paste the terminal output results for upload.
We encountered a similar issue with version 5.3. Suddenly, the latency increased significantly, and then it stopped syncing. The memory usage was also particularly high, reaching up to 50GB.
Is it also synchronized to MySQL through CDC? Did you identify the specific cause? How did you finally resolve it?
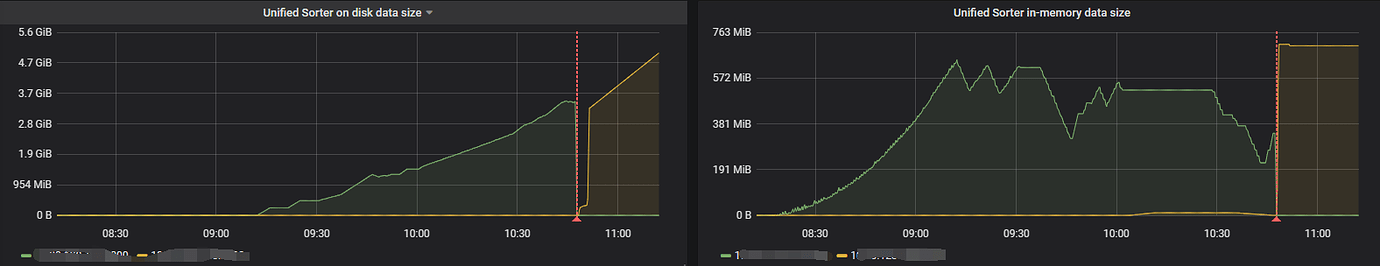
I previously encountered a situation where executing a large transaction on TiDB (backing up a table using insert into select) caused TiCDC to experience continuous delays. Looking at your monitoring information, Unified Sort on disk keeps increasing, which still seems to indicate a large transaction.
At that time, I first identified which table was causing the delay, then modified the changfeed to temporarily stop syncing that table and prioritized restoring the sync for other tables. I used Dumpling to export that table and created a separate changfeed to sync it, thereby skipping the large transaction. Once the business data caught up, I planned to find a time to merge the two changfeeds.
It should not be a transaction issue. I only synchronized one table, and this table only has insert operations. The Unified Sort on disk keeps growing and continues to increase, and I can’t pinpoint the exact reason for this.
Check if there are any large index addition DDL operations on the upstream TiDB synchronization table? Or if a DDL operation was just performed.
Execute cdc cli changefeed query -s --pd=http://10.0.10.25:2379 --changefeed-id=simple-replication-task to check if there are any errors in the current synchronization task.
It should be a large transaction. CDC is blocked by the transaction. TiDB’s table structure modification is online DDL, which is completed very quickly, unlike MySQL. With such synchronization, when the data volume increases, MySQL cannot handle it. This just proves the excellence of TiDB.
Starting from 6:34, a large number of these logs appeared. Did something happen to TiKV at this time?
[2022/06/28 06:34:00.826 +08:00] [WARN] [client.go:1543] ["region not receiving resolved event from tikv or resolved ts is not pushing for too long time, try to resolve lock"] [regionID=4149003] [span="[7480000000000004ff415f72800000000
9ff1900410000000000fa, 7480000000000004ff415f728000000009ff1c9a5f0000000000fa)"] [duration=21.35s] [lastEvent=132.861559ms] [resolvedTs=434207252666122299]
[2022/06/28 06:34:00.830 +08:00] [WARN] [client.go:1543] ["region not receiving resolved event from tikv or resolved ts is not pushing for too long time, try to resolve lock"] [regionID=4107597] [span="[7480000000000004ffbf5f72800000000
1ff5cdfe10000000000fa, 7480000000000004ffbf5f728000000001ff607c870000000000fa)"] [duration=21.35s] [lastEvent=136.812613ms] [resolvedTs=434207252666122299]
[2022/06/28 06:34:00.836 +08:00] [WARN] [client.go:1543] ["region not receiving resolved event from tikv or resolved ts is not pushing for too long time, try to resolve lock"] [regionID=4044439] [span="[7480000000000004ffbb5f72800000000
3ff3564880000000000fa, 7480000000000004ffbb5f728000000003ff3902770000000000fa)"] [duration=21.35s] [lastEvent=141.137059ms] [resolvedTs=434207252666122299]
The synchronized table did not perform any DDL operations today, and the synchronization task status is also normal:
$ tiup ctl:v5.0.3 cdc changefeed query -s --pd=http://10.30.xx.xx:2379 --changefeed-id=xxxs-sync-task
Starting component ctl: /home/tidb/.tiup/components/ctl/v5.0.3/ctl cdc changefeed query -s --pd=http://10.30.xx.xx:2379 --changefeed-id=xxxs-sync-task
{
“state”: “normal”,
“tso”: 434211597270384728,
“checkpoint”: “2022-06-28 11:09:52.810”,
“error”: null
}
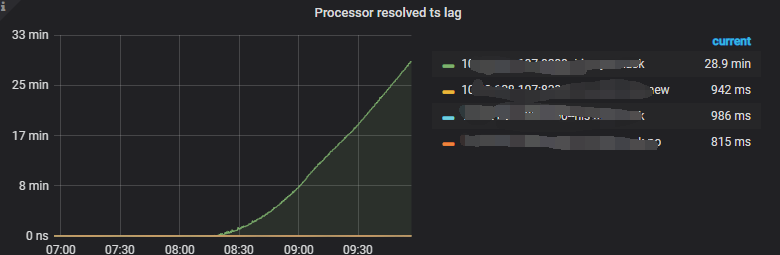
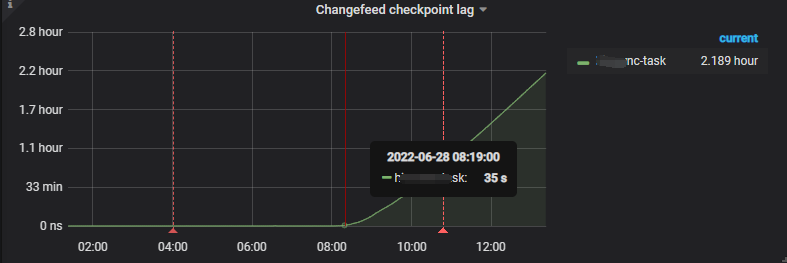
At 6:34, there were no anomalies with TiKV. According to the monitoring, the TiCDC synchronization delay started to gradually increase around 08:20 in the morning.
Moreover, the delay is getting larger and larger now.
Is there MySQL monitoring? Is it possible that the downstream MySQL performance is insufficient?
I suggest checking the MySQL general log, binary log, or doing a tcpdump on port 3306. I previously encountered a situation where a developer was performing a large number of deletes, which blocked other operations. This was detected through tcpdump monitoring.
However, from your log, the QPS was 0 the day before yesterday and yesterday, and data only started coming in from early this morning.
[2022/06/27 23:31:07.247 +08:00] ... [changefeed=xxx-task]  [count=0] [qps=0]
[2022/06/27 23:41:07.247 +08:00] ... [changefeed=xxx-task]  [count=0] [qps=0]
[2022/06/27 23:51:07.248 +08:00] ... [changefeed=xxx-task]  [count=0] [qps=0]
[2022/06/28 00:01:07.248 +08:00] ... [changefeed=xxx-task]  [count=119204] [qps=198]
[2022/06/28 00:11:07.249 +08:00] ... [changefeed=xxx-task]  [count=1008319] [qps=1680]
[2022/06/28 00:21:07.272 +08:00] ... [changefeed=xxx-task]  [count=932367] [qps=1553]
The data has always been synchronized because there are two CDCs. In the log of another CDC node, you can see the previous data synchronization, and the QPS is not zero.
 [2022/06/27 02:21:00.785 +08:00] [INFO] [statistics.go:126] ["sink replication status"] [name=mysql] [changefeed=xxxx-task] [capture=xx.xx.xx.108:8300] [count=429212] [qps=715]
[2022/06/27 02:31:00.789 +08:00] [INFO] [statistics.go:126] ["sink replication status"] [name=mysql] [changefeed=xxxx-task] [capture=xx.xx.xx.108:8300] [count=404536] [qps=674]
[2022/06/27 02:41:00.791 +08:00] [INFO] [statistics.go:126] ["sink replication status"] [name=mysql] [changefeed=xxxx-task] [capture=xx.xx.xx.108:8300] [count=384137] [qps=640]
[2022/06/27 02:51:00.797 +08:00] [INFO] [statistics.go:126] ["sink replication status"] [name=mysql] [changefeed=xxxx-task] [capture=xx.xx.xx.108:8300] [count=365038] [qps=608]
[2022/06/27 03:01:00.797 +08:00] [INFO] [statistics.go:126] ["sink replication status"] [name=mysql] [changefeed=xxxx-task] [capture=xx.xx.xx.108:8300] [count=350421] [qps=584]
[2022/06/27 03:11:00.837 +08:00] [INFO] [statistics.go:126] ["sink replication status"] [name=mysql] [changefeed=xxxx-task] [capture=xx.xx.xx.108:8300] [count=334392] [qps=557]
[2022/06/27 03:21:00.848 +08:00] [INFO] [statistics.go:126] ["sink replication status"] [name=mysql] [changefeed=xxxx-task] [capture=xx.xx.xx.108:8300] [count=325291] [qps=542]
[2022/06/27 03:31:00.904 +08:00] [INFO] [statistics.go:126] ["sink replication status"] [name=mysql] [changefeed=xxxx-task] [capture=xx.xx.xx.108:8300] [count=312800] [qps=521]
[2022/06/27 03:41:00.904 +08:00] [INFO] [statistics.go:126] ["sink replication status"] [name=mysql] [changefeed=xxxx-task] [capture=xx.xx.xx.108:8300] [count=302907] [qps=504]
[2022/06/27 03:51:00.909 +08:00] [INFO] [statistics.go:126] ["sink replication status"] [name=mysql] [changefeed=xxxx-task] [capture=xx.xx.xx.108:8300] [count=293315] [qps=488]
[2022/06/27 04:01:00.909 +08:00] [INFO] [statistics.go:126] ["sink replication status"] [name=mysql] [changefeed=xxxx-task] [capture=xx.xx.xx.108:8300] [count=288179] [qps=480]
[2022/06/27 04:11:00.910 +08:00] [INFO] [statistics.go:126] ["sink replication status"] [name=mysql] [changefeed=xxxx-task] [capture=xx.xx.xx.108:8300] [count=279882] [qps=466]
[2022/06/27 04:21:00.910 +08:00] [INFO] [statistics.go:126] ["sink replication status"] [name=mysql] [changefeed=xxxx-task] [capture=xx.xx.xx.108:8300] [count=278376] [qps=463]
[2022/06/27 04:31:00.921 +08:00] [INFO] [statistics.go:126] ["sink replication status"] [name=mysql] [changefeed=xxxx-task] [capture=xx.xx.xx.108:8300] [count=275506] [qps=459]
[2022/06/27 04:41:00.921 +08:00] [INFO] [statistics.go:126] ["sink replication status"] [name=mysql] [changefeed=xxxx-task] [capture=xx.xx.xx.108:8300] [count=277555] [qps=462]
[2022/06/27 04:51:00.922 +08:00] [INFO] [statistics.go:126] ["sink replication status"] [name=mysql] [changefeed=xxxx-task] [capture=xx.xx.xx.108:8300] [count=279637] [qps=466
Below is the log of another CDC node:
cdc.log.tar.gz (15.8 MB)
The issue has been resolved, it was caused by the performance problem of the downstream MySQL.
Thanks to @ dba-kit @ 代晓磊_Mars @ ShawnYan @ 蒋明tidb狂热爱好者 for providing the troubleshooting ideas.
Can you post what the issue is with the downstream MySQL?
Hahaha, indeed.
If TiDB confirms that there are no changes and no large transactions, then let’s change direction and investigate the performance of downstream MySQL. Is it possible that the write speed has slowed down, affecting TiCDC?