TiCDC synchronizing TiDB data to downstream MySQL is very slow, and the downstream MySQL instance generates a lot of binlog logs

Note:
This topic has been translated from a Chinese forum by GPT and might contain errors.

Original topic: TiCDC同步TiDB数据到下游MySQL很慢,而且下游MySQL实例会增加很多的binlog日志

| username: Johnpan

TiDB version 5.4.0, TiCDC version 5.4.0
Currently, when using TiCDC tasks to synchronize TiDB data to downstream MySQL instances, there is a significant delay. The incremental data is only 1G per day, but the task is already delayed by 11 hours. Why is this happening? How can it be optimized?
Additionally, the speed at which binlogs are generated by the downstream MySQL instance is very fast, basically 1G of logs per minute. Is there any optimization for this?

【TiDB Usage Environment】Production\Testing Environment\POC
【TiDB Version】
【Encountered Issues】
【Reproduction Path】What operations were performed that led to the issue
【Issue Phenomenon and Impact】
【Attachments】

  • Relevant logs, configuration files, Grafana monitoring (https://metricstool.pingcap.com/)
  • TiUP Cluster Display information
  • TiUP Cluster Edit config information
  • TiDB-Overview monitoring
  • Corresponding module Grafana monitoring (if any, such as BR, TiDB-binlog, TiCDC, etc.)
  • Corresponding module logs (including logs from 1 hour before and after the issue)

If the question is related to performance optimization or troubleshooting, please download the script and run it. Please select all and copy-paste the terminal output results for upload.
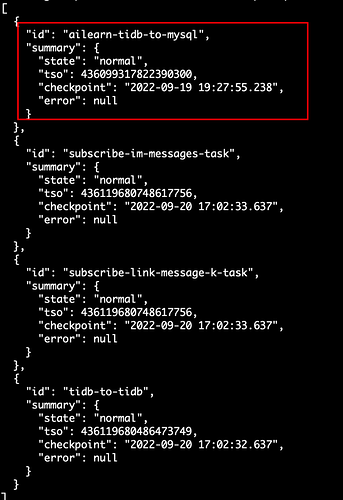
| username: Meditator | Original post link

  1. Are the sinks for these tasks all the same MySQL instance, or are they different?
  2. Does the downstream MySQL for the task “ailearn-tidb-to-mysql” generate 1GB of logs per minute? Generating 1GB of logs per minute is already a very large write volume.
  3. Can you send the logs corresponding to the changefeed?
  4. For generating 1GB of binlog logs per minute, can you check the binlog to see what data is being written?
  5. What is the architecture of the downstream MySQL? I suspect it is dual-master, and there is a third-party server_id event in the binlog.
| username: Johnpan | Original post link

  1. The same MySQL instance
  2. The volume is very large, but actually our data is only 1G per day. Why are there so many new logs? Is this related to the GC version of the data? Do all GC versions need to be executed once to generate so many logs?
  3. How to view changefeed logs?
  4. I saw that MySQL’s binlog is all replace into
  5. The downstream MySQL is a single instance specifically used for this task
| username: Meditator | Original post link

  1. The upstream TiDB has a daily data volume of only 1G, but the downstream MySQL binlog can generate 1G of binlog logs per minute. Can you analyze whether these binlog logs meet expectations?
  2. Check the official documentation to see which processor corresponds to the changefeed, and then check the logs of the corresponding capture (cdc-server). Refer here: https://docs.pingcap.com/zh/tidb/stable/manage-ticdc
  3. Theoretically, such a bizarre issue should not occur unless there is a problem with this changefeed. Can you post the configuration of this changefeed for us to take a look?
| username: Johnpan | Original post link

Sorry, some of the synchronization involves full data, so the binlog volume is large.

| username: xiaohetao | Original post link

You are probably referring to full data synchronization now, not incremental, right?

| username: Johnpan | Original post link

Yes, there are other classmates fully tracking the data.

| username: xiaohetao | Original post link

Oh, okay.