Note:
This topic has been translated from a Chinese forum by GPT and might contain errors.
Original topic: tidb 5.4.0-sql卡住
【TiDB Usage Environment】Production Environment / Testing / Poc
【TiDB Version】5.4.0
【Encountered Problem】
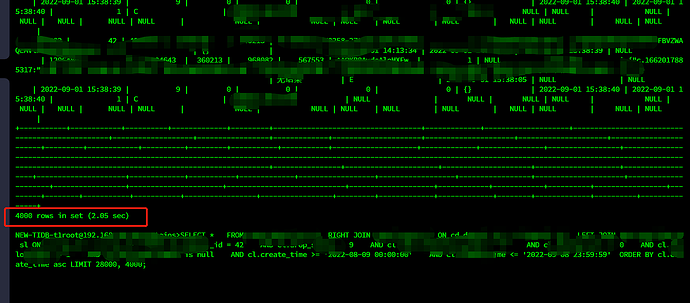
Running the SQL once is fine, results come out in 2 seconds, but running it multiple times causes it to get stuck. The table data volume is not large, the largest table does not exceed 1 million, as shown in the picture below:
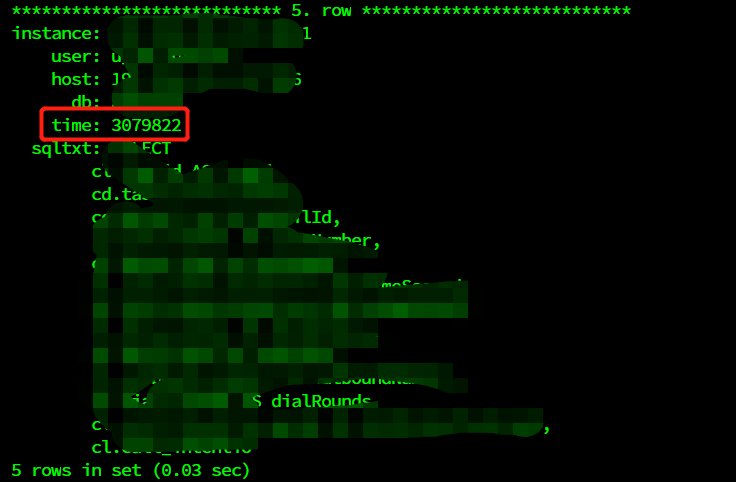
The SQL running in the production environment has been stuck for over 3 million seconds.
【Reproduction Path】Operations performed that led to the problem
【Problem Phenomenon and Impact】
SQL gets stuck, and the page query does not return results.
【Attachments】
Please provide the version information of each component, such as cdc/tikv, which can be obtained by executing cdc version/tikv-server --version.
After testing, version 5.4.2 also has this issue.
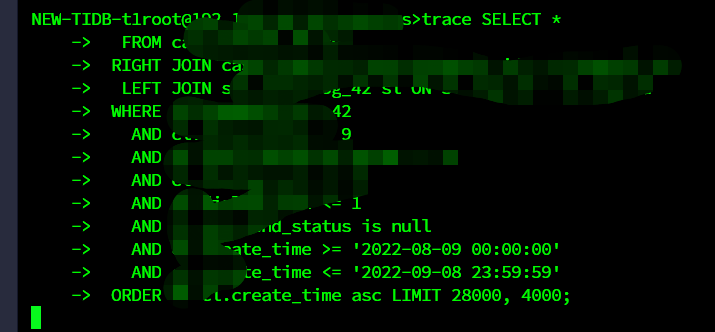
The SQL contains both right join and left join. The first limit pagination query works fine, but the second one gets stuck.
After the trace command, follow it with your SQL statement and post the results of the second execution for us to review.
Execution fails, it directly freezes.
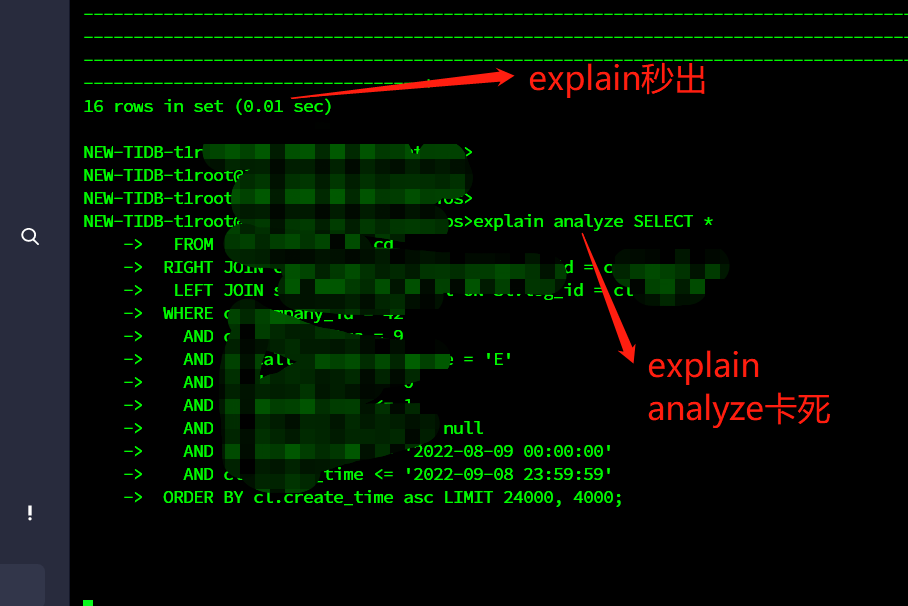
Just use analyze to check the execution plan.
“EXPLAIN does not actually execute, it only views the execution plan. EXPLAIN ANALYZE actually executes and views the execution plan at the same time.”
The “explain analyze” execution got stuck on the first run.
It seems to be stuck during parsing.
You directly analyze and send out the execution plan to have a look. It should be the execution plan that’s not working.
When actually executing the SQL, the first time is very fast, it takes seconds, but the second time it gets stuck. It’s been over a month without finding out why. If the execution plan is not good, it would still produce a result, albeit slower. The current situation is that the second execution directly gets stuck and does not produce a result.
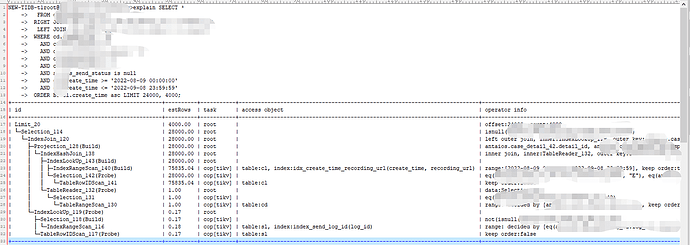
Here is the execution plan
What about collecting statistics?
Brother, capture the goroutines and take a look. The capture method is:
curl http://:10080/debug/pprof/goroutine?debug=2 >goroutines.txt
Then upload it and take a look.
This is what I captured when my SQL execution got stuck. Please take a look, thanks.
I found that the end of the SQL that got stuck when I executed it was limit 32000,4000, while in the show full processlist the end of the SQL was limit 28000,4000.
Tried analyze, but it didn’t work.
This is a BUG, refer to: indexHashJoin hang in handleTask · Issue #35638 · pingcap/tidb · GitHub
Fixed in 5.4.3, it is recommended to apply the patch and upgrade.
It should be a code issue.
