TiDB 5.4.2 System Table Crash: SELECT * FROM INFORMATION_SCHEMA.TABLES limit 3 Hangs

Note:
This topic has been translated from a Chinese forum by GPT and might contain errors.

Original topic: tidb5.4.2系统表崩溃 SELECT * FROM INFORMATION_SCHEMA.TABLES limit 3 都卡死

| username: heming

【TiDB Usage Environment】Production
【TiDB Version】5.4.2
【Encountered Problem】
Backup log anomaly in the early morning, found the following error:
dump failed: sql: SELECT COUNT(1) as c FROM INFORMATION_SCHEMA.TABLES WHERE TABLE_TYPE=‘SEQUENCE’: invalid connection
Tried to query the table but got no response.
SELECT * FROM INFORMATION_SCHEMA.TABLES limit 3;
SELECT count(1) FROM INFORMATION_SCHEMA.TABLES;
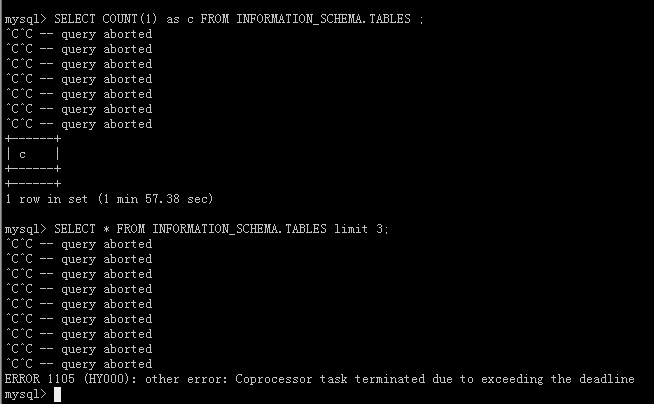
image
[root@xxx-xxx223 tidblog]# grep terminated tidb.log |grep -i erro | more
[2022/09/10 10:24:09.397 +08:00] [WARN] [coprocessor.go:970] [“other error”] [conn=484791] [txnStartTS=435886730364583943] [regionID=36387611] [storeAddr=xxx.xx.xx.158:20160] [error=“other error: Coprocessor task terminated due to exceeding the deadline”]
[2022/09/10 10:24:09.398 +08:00] [INFO] [conn.go:1117] [“command dispatched failed”] [conn=484791] [connInfo=“id:484791, addr:127.0.0.1:58723 status:10, collation:utf8_general_ci, user:tidbdba”] [command=Query] [status=“inTxn:0, autocommit:1”] [sql=“SELECT * FROM INFORMATION_SCHEMA.TABLES limit 3”] [txn_mode=PESSIMISTIC] [err=“other error: Coprocessor task terminated due to exceeding the deadline
github.com/pingcap/tidb/store/copr.(*copIteratorWorker).handleCopResponse
\t/home/jenkins/agent/workspace/build-common/go/src/github.com/pingcap/tidb/store/copr/coprocessor.go:969
github.com/pingcap/tidb/store/copr.(*copIteratorWorker).handleTaskOnce
\t/home/jenkins/agent/workspace/build-common/go/src/github.com/pingcap/tidb/store/copr/coprocessor.go:784
github.com/pingcap/tidb/store/copr.(*copIteratorWorker).handleTask
\t/home/jenkins/agent/workspace/build-common/go/src/github.com/pingcap/tidb/store/copr/coprocessor.go:668
github.com/pingcap/tidb/store/copr.(*copIteratorWorker).run
\t/home/jenkins/agent/workspace/build-common/go/src/github.com/pingcap/tidb/store/copr/coprocessor.go:410
runtime.goexit
\t/usr/local/go/src/runtime/asm_amd64.s:1371”]
【Reproduction Path】What operations were done to cause the problem
【Problem Phenomenon and Impact】
System tables are unavailable, not sure what the impact will be on the production system.
DDL was still normal at around 1 AM. Now it’s not advisable to operate DDL. There will be a batch of DDL operations at 11:30.

| username: h5n1 | Original post link

Check the number of rows in the tables mysql.stats_meta and mysql.stats_histograms, and then check the setting of the variable tidb_enable_cascades_planner.

| username: heming | Original post link

Earlier, I added some error logs from TiDB. Please take a look when you have time.

mysql> select count(1) from mysql.stats_meta;
±---------+
| count(1) |
±---------+
| 4031 |
±---------+
1 row in set (0.82 sec)
mysql> select count(1) from mysql.stats_histograms;
±---------+
| count(1) |
±---------+
| 510144 |
±---------+
1 row in set (0.41 sec)

@@tidb_enable_cascades_planner |
±-------------------------------+
| 0

| username: h5n1 | Original post link

510,000 doesn’t seem like a large amount.

| username: heming | Original post link

Both statements can succeed, but the tables are stuck. Check if the TiDB error messages are useful.

| username: h5n1 | Original post link

The count is using the primary key index. Try executing the SQL in the screenshot and see.

| username: heming | Original post link

Very fast. I have sent you a private message. Can we add each other on WeChat for more convenient and quick communication?

mysql> select count(1) from (select table_id, count from mysql.stats_meta) a; 
+----------+
| count(1) |
+----------+
|     4031 |
+----------+
1 row in set (0.87 sec)

mysql> select count(1) from (select table_id, hist_id, tot_col_size from mysql.stats_histograms where is_index=0) a;
+----------+
| count(1) |
+----------+
|   496678 |
+----------+
1 row in set (0.42 sec)
| username: h5n1 | Original post link

Let’s wait for the official experts to take a look.

| username: forever | Original post link

How about tracing the SQL?

| username: heming | Original post link

After adjusting the relevant TiKV weight according to the information in the TiDB error log, there is now some response.

| username: heming | Original post link

How did you trace it? Is there a relevant documentation URL?

| username: tidb狂热爱好者 | Original post link

First, stop the TiDB frontend service, then add and execute the second limit.

| username: xiaohetao | Original post link

What were the original values of LEADER-WEIGHT and REGION-WEIGHT in the cluster? If they were default values, according to the parameter description below, does adjusting them reduce the number of leaders on this store and increase the number of regions?

| username: system | Original post link

This topic was automatically closed 60 days after the last reply. New replies are no longer allowed.